. 2023 Sep 21;29(23):4870–4882. doi: 10.1158/1078-0432.CCR-23-1182

Figure 6.

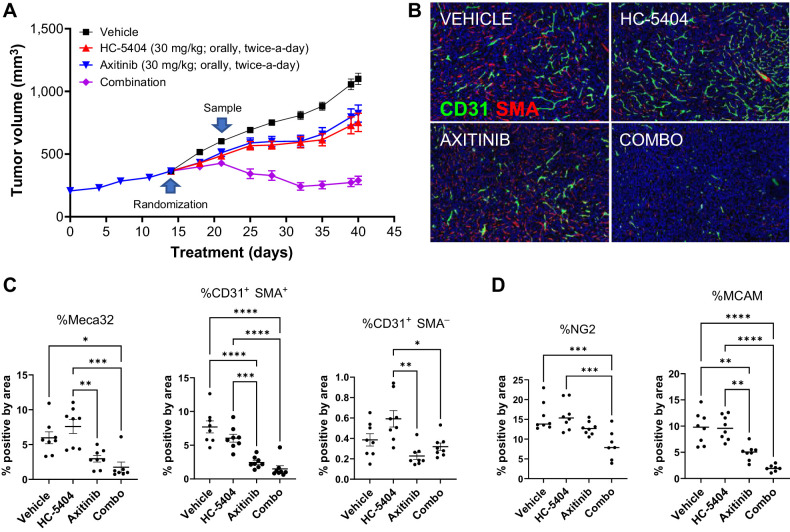
Figure 6. Addition of HC-5404 to axitinib regimen induces tumor regression. A, 786-O tumor growth across the study period. Xenografts that progressed in presence of axitinib for 14 days were rerandomized and transferred to indicated treatment groups for an additional 28 days. Data represent mean ± S.E.M. Final tumor volume analyzed by Welch ANOVA. Data represent mean ± S.E.M., n = 8 mice per group (**, P < 0.01; ***, P < 0.005; ****, P < 0.001). B, IHC images of xenograft sections stained with antibodies specific for CD31 and SMA. C, Quantification of proportion of cells that stained positive for Meca32, CD31+SMA- (immature blood vessels), or CD31+SMA+ (mature blood vessels) in B. One-way ANOVA was used to evaluate the statistical significance between groups. Asterisks indicate statistical significance (*, P < 0.05; **, P < 0.01; ***, P < 0.005; ****, P < 0.001). D, Quantification of IHC staining of tumor sections using antibodies specific for the pericyte markers NG2 and MCAM. One-way ANOVA statistical analysis evaluated differences between treatment groups; asterisks indicate significant differences (**, P < 0.01; ***, P < 0.005; ****, P < 0.001).

Addition of HC-5404 to axitinib regimen induces tumor regression. A, 786-O tumor growth across the study period. Xenografts that progressed in presence of axitinib for 14 days were rerandomized and transferred to indicated treatment groups for an additional 28 days. Data represent mean ± S.E.M. Final tumor volume analyzed by Welch ANOVA. Data represent mean ± S.E.M., n = 8 mice per group (**, P < 0.01; ***, P < 0.005; ****, P < 0.001). B, IHC images of xenograft sections stained with antibodies specific for CD31 and SMA. C, Quantification of proportion of cells that stained positive for Meca32, CD31+SMA- (immature blood vessels), or CD31+SMA+ (mature blood vessels) in B. One-way ANOVA was used to evaluate the statistical significance between groups. Asterisks indicate statistical significance (*, P < 0.05; **, P < 0.01; ***, P < 0.005; ****, P < 0.001). D, Quantification of IHC staining of tumor sections using antibodies specific for the pericyte markers NG2 and MCAM. One-way ANOVA statistical analysis evaluated differences between treatment groups; asterisks indicate significant differences (**, P < 0.01; ***, P < 0.005; ****, P < 0.001).