. 2023 Sep 29;29(23):4949–4957. doi: 10.1158/1078-0432.CCR-23-1397

Figure 4.

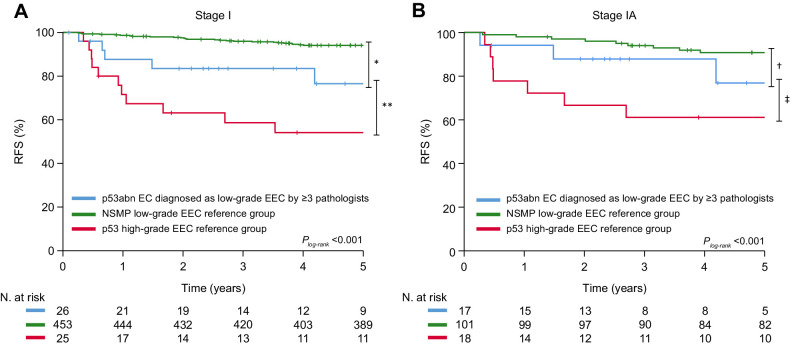
Figure 4. Kaplan–Meier survival curves for 5-year probability recurrence-free for cases assigned low-grade (grade 1–2) by ≥3 expert pathologists and stage I low-grade NSMP EEC and stage I high-grade p53abn EEC controls. Figure 4A shows the Kaplan–Meier survival curves for stage I p53abn low-grade EEC, NSMP low-grade EEC, and p53abn high-grade EEC. Figure 4B includes only stage IA cases. Differences in survival were assessed with the log-rank test: *, P = 0.003; **, P = 0.09; †, P = 0.14; ‡, P = 0.023.

Kaplan–Meier survival curves for 5-year probability recurrence-free for cases assigned low-grade (grade 1–2) by ≥3 expert pathologists and stage I low-grade NSMP EEC and stage I high-grade p53abn EEC controls. Figure 4A shows the Kaplan–Meier survival curves for stage I p53abn low-grade EEC, NSMP low-grade EEC, and p53abn high-grade EEC. Figure 4B includes only stage IA cases. Differences in survival were assessed with the log-rank test: *, P = 0.003; **, P = 0.09; †, P = 0.14; ‡, P = 0.023.