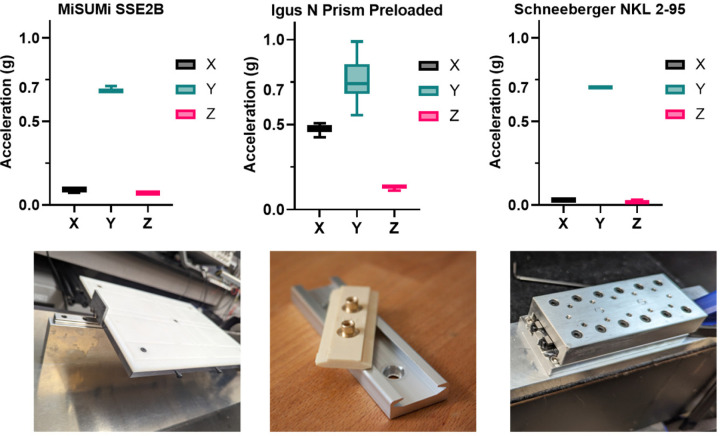
Figure 1: Comparison of peak-to-peak accelerations for three different linear guides under 90Hz, 0.7g peak-to-peak vibration.
The guides tested were an N-Prism linear guide, a Schneeberger linear guide, and a Misumi linear guide. Box and violin plots represent the distribution of peak-to-peak accelerations in the X, Y, and Z axes over a 20-minute test period. The Schneeberger guide demonstrated the most consistent performance, with a peak-to-peak acceleration of 0.7g in the Y-axis and minimal vibration translation to the X and Z axes.

