Figure 2.
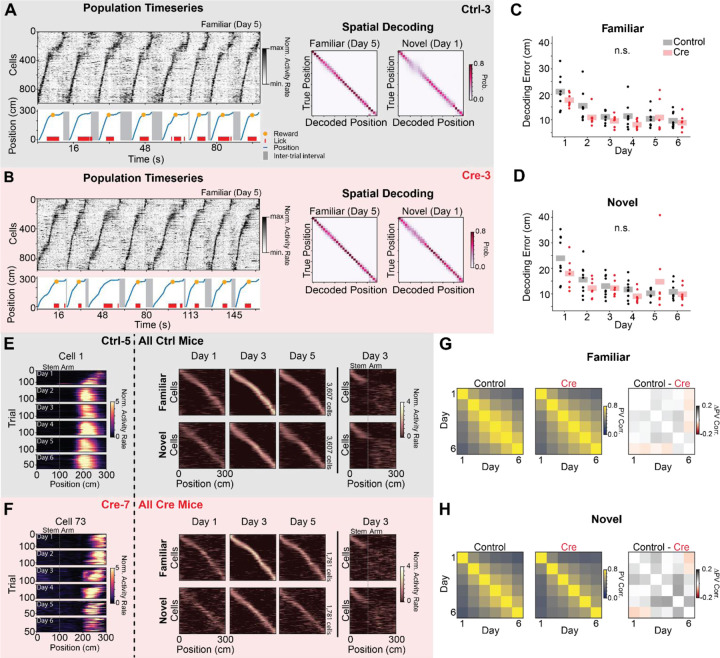
CA1 Stx3 deletion does not affect gross measures of place code quality and stability. A-D) Accurate neural coding of position does not require CA1 Stx3
A) Example place cell timeseries (“Population Timeseries”, Left) and spatial decoding (“Spatial Decoding”, Right) from a single control animal (Ctrl-3; gray). Population Timeseries: Top- Activity rate of co-recorded place cells over time from a subset of familiar arm trials on day 5. Cells are sorted by their location of peak activity in the average familiar trial activity rate map. Bottom - The position of the animal on the virtual track over time (blue). Shaded regions indicate inter-trial intervals. Red dashes are times of licks, and the orange dot indicates when a reward was dispensed. Rewards were randomly omitted on 10% of trials. Note the tight correspondence between the position of the animal on the track and the sequence of neural activity. Spatial Decoding: Left - Posterior distributions from leave-one-trial-out naive Bayes decoding of position from familiar trials on day 5 from the same example animal (Ctrl-3, N=1208 cells, 120 trials). Right - Same as (Left) for novel trials on day 1 (N=1568 cells, 20 trials). Note accurate decoding even on the initial novel trials.
B) Same as (A) for a single Cre animal (Cre-3; red). Note similar place cell sequences and decoding accuracy between (A) and (B). (Day 5 familiar trial decoding: N=1087 cells, 17 trials, Day 1 novel trial decoding: N=936 cells, 17 trials)
C) Average leave-one-trial out naive Bayes spatial decoding error on familiar trials on each day. Dots indicate the average error of 50 models trained with a random subset of neurons chosen with replacement (n=128 cells per model) for each mouse. Shaded bars indicate across animal mean. [N=9 control mice, 8 Cre mice, 6 days. Mixed effects ANOVA: virus main effect F(1,14)=1.75 p=0.207, day main effect F(5,70)=30.2 p=3.25×10⁻¹⁶, interaction F(5,70)=1.70 p=0.145; Posthoc paired t-test (Holm-corrected p-value) comparing decoding error on each day: day 1 vs day 2 - t=8.17 p=7.96 × 10⁻⁶; day 1 vs day 3 - t=9.26 p=1.76×10⁻⁶; day 1 vs day 4 - t=10.2 p=5.79×10⁻⁷; day 1 vs day 5 - t=6.39 p=1.33×10⁻⁴; day 1 vs day 6 - t=9.68 p=1.07×10⁻⁶; day 2 vs day 3 - t=3.35 p=0.039; day 2 vs day 6 - t=3.64 p=.024; all other comparisons p>.05]
D) Same as (C) for novel trials. [N=9 control mice, 8 Cre mice, 6 days. Mixed effects ANOVA: virus main effect F(1,14)=.576 p=0.460, day main effect F(5,70)=14.6 p=8.74×10⁻¹⁰, interaction F(5,70)=2.96 p=0.017; Posthoc paired t-test (Holm-corrected p-value) comparing decoding error on each day: day 1 vs day 2- control t=5.60 p=6.61×10⁻⁴; day 1 vs day 3 - t=5.37 p=9.28×10⁻⁴; day 1 vs day 4 - t=8.64 p=5.00×10⁻⁶; day 1 vs day 5 - t=3.38 p=.037; day 1 vs day 6 - t=6.52 p=1.35×10⁻⁴; day 2 vs day 4 - t=3.67 p=.023; day 2 vs day 6 - t=3.75 p=.021; all other comparisons p>.05]
E-H) Comparable stability of spatial coding between Control and Cre animals.
E) Activity of place cells tracked over all 6 days from Control animals. Left - Position-binned activity rate of a single place cell in familiar trials from all days (mouse: Ctrl-5, cell 1). Right - Position-binned trial-averaged activity rate (z-scored) of all place cells tracked over days 1–5 (top row - familiar trials, bottom row - novel trials). Cells are plotted in the same order for each plot within a row and are sorted by their location of peak activity on odd-numbered trials from day 3. Day 3 heatmaps indicate average activity on even-numbered trials. All other heatmaps indicate the average of all trials. These heatmaps show a stable tiling of place cells across days. Far right - (top) novel trial activity with cells sorted by familiar trial activity. (bottom) Familiar trial activity with cells with cells sorted by novel trial activity. Place cells that code for the stem of the Y-Maze are visible at the beginning of the track in both conditions. Place cells remap on the arms of the maze as indicated by the disorganized activity rate maps.
F) Same as (E) for place cells tracked over all experimental days in Cre animals.
G) Across animal average day x day population vector correlation (PV corr.) for familiar trials (Left: Control animals, Middle: Cre animals, Right: difference between groups). Each animal’s population vector is calculated using the trial-averaged spatial activity rate map for each cell on each day. [N=9 control mice, 7 Cre mice. Right: control vs Cre unpaired t-test of average across day PV correlation t=.333 p=.745]
H) Same as (G) for novel trials. [N=9 control mice, 7 Cre mice. Right: control vs Cre unpaired t-test of average across day PV correlation t=1.27 p=.223]
See also Figures S3 & S4.

