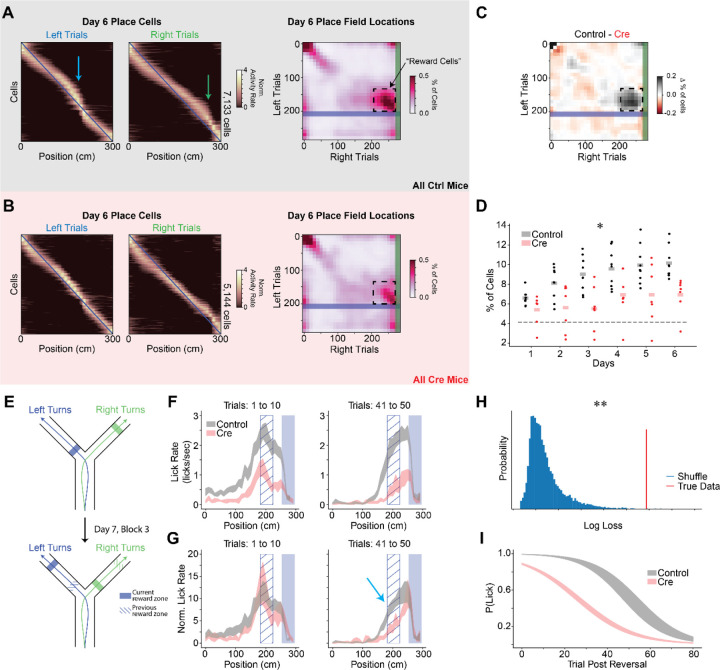
Figure 5.
CA1 Stx3 is necessary for reward location memory.
A-D) Stx3 is necessary for recruitment of place cells to reward locations.
A) Left - Day 6 trial-averaged place cell activity (even trials only, odd trial sorted, z-scored) from all control animals. Arrows indicate place cell overrepresentation of rewarded locations. Blue line shows diagonal as a reference. Right - Joint normalized histogram of locations of peak activity on left and right trials for place cells on day 6. Rewarded locations are highlighted by the shaded regions (blue - left reward zone, green-right reward zone). Cells that do not remap across trial types will lie on the diagonal. Cells that remap specifically to match shifts in the reward locations will lie on the off-diagonal near the intersection of the reward zones (“reward cells”, dashed box).
B) Same as (A) for Cre animals.
C) The difference between control and Cre histograms highlights fewer reward cells in the Cre mice.
D) Proportion of the population defined as “reward cells” shown for each mouse on each day. Statistical tests performed on logit transformed proportions. [N=9 control, 7 Cre mice, 6 days, Mixed effects ANOVA: virus main effect F(1,14)=8.49 p=.011, day main effect F(5,70)=10.2 p=2.40×10⁻⁷, interaction F(5,70)=1.46 p=.214]. Dashed line indicates the proportion of reward coding neurons expected by random remapping between novel and familiar arms with constant coding for the stem of the maze. Across-day average fraction of reward cells is greater than chance in control but not Cre animals [One sample t-test: control - t=16.7 p=1.64×10⁻⁷, Cre - t=2.11 p=.080]
E-G) After moving reward locations, Cre animals extinguish licking faster at previously rewarded locations.
E) Schematic of the reward reversal task. On day 7, the animals performed the first 2 blocks of trials as in day 6 (randomly interleaved left and right trials). At the beginning of block 3, the reward locations on the two arms were switched. The rewards stayed in this new location for the remaining trials on day 7 and all trials on day 8.
F) Lick rate as a function of position for binned left arm trials following the reward reversal (N=9 control mice, 6 Cre mice). Data are shown as across animal mean ± SEM. Solid blue shaded region indicates the current reward zone. Hatched blue region indicates the previous reward zone.
G) Normalized lick rate as a function of position for binned trials following the reward reversal. We divide each animal’s lick rate by the mean lick rate on the 10 trials preceding the reversal (N=9 control mice, 6 Cre mice). Data are shown as across animal mean ± SEM. Cyan arrow highlights slower licking extinction at the old reward zone for control mice.
H-I) A mixed effects binomial regression was used to quantify the probability of licking more than once in the previous reward anticipatory zone during left arm extinction trials.
H) Log loss of model fit (red) vs shuffled distribution (blue). Shuffled distribution was generated by randomly swapping mouse labels of control vs Cre (p=.002).
I) Model predictions. Probability of licking more than once in the previous reward anticipatory zone is plotted as a function of trial (black-control, red-Cre). Shaded region shows the best fit model parameters ± estimated standard deviation of the parameters.
See also Figure S7.

