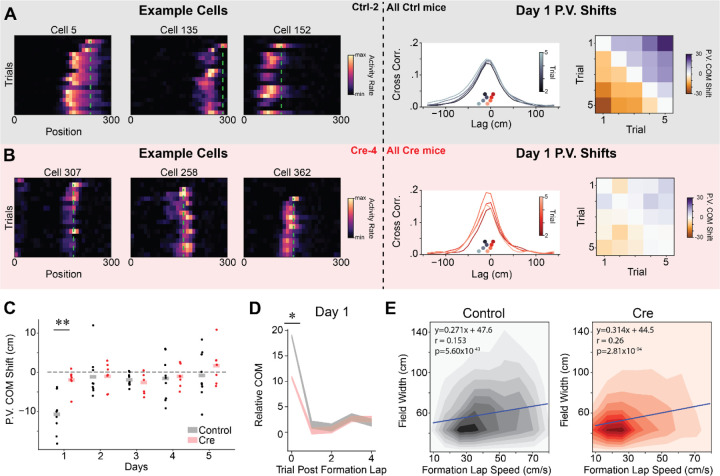
Figure 6.
CA1 Stx3 contributes to experience dependent place field shifts in novel environments.
A) Left - Example co-recorded place cells form a control mouse (Ctrl-2) during novel arm trials on day 1. Cells display an abrupt backwards shift of their place fields after the field first appears. Green dashed line indicates location of peak activity on the place field induction lap. Middle - Cross-correlation of population vector activity quantifies population backward shift. For illustration, we show the across animal average population vector (PV) spatial cross-correlation between the first novel trial and the next 4 novel trials on day 1. Inset scatterplot (above x-axis, underneath cross-correlation plot) shows the center of mass (COM) of the cross-correlation (“PV COM shift”) for each trial for both control (greyscale colormap) and Cre (red colormap). Control PV shifts are to the left of the Cre PV shifts indicating a larger magnitude backward shift for control trials. Right - Across animal average PV COM shift on day 1 for each pair of initial novel trials.
B) Same as (A) for data from Cre animals (example cells Cre-4). Note that smaller abrupt shifts are visible in example cells.
C) Average initial novel trial PV shift for each mouse on each day. Dots are the average PV shift for all pairs of initial novel trials on each day for each mouse. Shaded bars are across animal means. [N=9 control mice, 7 Cre mice, 5 days (day 6 excluded). Mixed effects ANOVA: virus main effect F(1,14)=6.41 p=0.024, day main effect F(4,56)=6.09 p=3.85×10⁻⁴, interaction F(4,56)=2.95 p=0.028. Posthoc unpaired t-test: control vs Cre for day 1-t=−4.63 p=0.002 (Holm-corrected), all other days p>0.05. Posthoc paired t-test (Holm-corrected p-value) for PV shift different from 0: control: day 1 t=−6.66 p=.001, all other days p>.05; Cre: all days p>.05].
D) Individual place fields shift abruptly following their formation lap in novel trials from Day 1. Control animal place fields shift to a greater extent. The COM of place cell activity on each trial, relative to the average place field COM, following the place field’s formation lap. Shaded regions indicate across place field mean +/− SEM (gray-control, red-Cre). After controlling for formation lap running speed through the place field, COM shifts were significantly greater on day 1 for control animals (Linear mixed effects regression, Day 1 - χ2 =6.37, p=.016).
E) The place field width is correlated with running speed through the place field on the formation lap in both groups. Heatmaps show the joint histogram of place field widths and place field formation lap speed through the place field (Left - Control, Right - Cre). Blue line shows the best fit regression for each condition from mixed effects linear regression. Neither the intercept nor the slope of the regression differs between Cre and control (Linear mixed effects regression, Wald test p>.05)
See also Figure S8.

