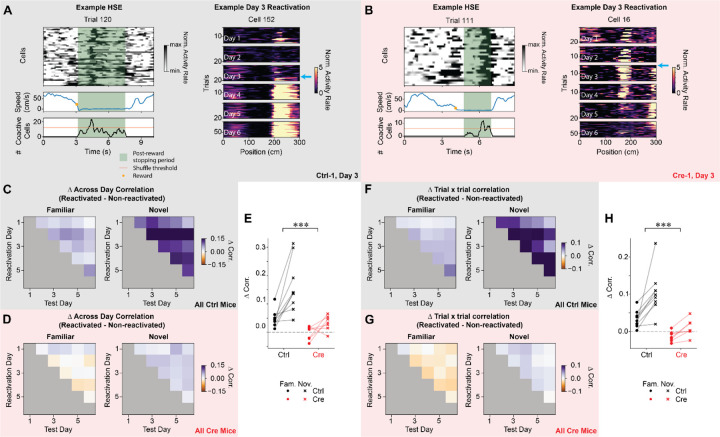
Figure 7.
CA1 Stx3 is necessary for offline consolidation of place codes.
A) Left - Example highly synchronous event (HSE) from a novel trial from a control animal (Ctrl-1) on day 3. Top - Activity rate of cells that participate in the HSE over time on a single trial. Middle - Running speed. Orange dot indicates the time of reward delivery. Bottom - Number of simultaneously active neurons in the population during the post-reward stopping period. Orange line indicates threshold for defining a HSE from shuffled data. Green shading indicates post-reward stopping periods eligible for HSE analysis. Right - Example novel arm place cell that is reactivated during a HSE for the first time on day 3 from a control animal (Ctrl-1). The cyan arrow highlights the trial of the first HSE in which the cell participates. Note that the place field appears more stable and reliable on subsequent days.
B) Same as (A) for a Cre animal (Cre-1). Right - Note that the place cell destabilizes on subsequent days.
C-E) For control but not Cre animals, cells that are reactivated during HSEs are more stable across days than cells that are not reactivated during HSEs. This effect is greater in novel trials.
C) Difference in across day spatial rate map correlation between reactivated and non-reactivated cells for control animals in familiar and novel trials. Data shown as across animal average.
D) Same as (C) for Cre animals.
E) Average difference in across day correlation between reactivated and non-reactivated cells. Each point is the average difference in correlation for each mouse (dots - familiar trials, “x” - novel trials, black - control, red - Cre). Reactivated cells in control animals have higher across day correlation than non-reactivated cells for both familiar (one-sample t-test: t=4.67 p=.005, all p-values are Holm-corrected for multiple comparisons) and novel trials (one-sample t-test: t=5.23 p=.003). In Cre animals, reactivated cells have higher across day correlation for novel trials (one-sample t-test: t=3.23 p=.036) but not for familiar trials (one-sample t-test: t=−.367 p=.726). The increase in across day correlation for reactivated cells is greater for control animals than Cre animals. This increase in stability of the neural representation is larger for novel trials than familiar trials [N=9 control mice, 7 Cre mice. Mixed effects ANOVA: virus main effect F(1,14)=18.1 p=7.94×10⁻⁴, familiar vs novel main effect F(1,14)=20.7 p=4.54×10⁻⁴, interaction F(1,14)=4.91 p=0.044]. Furthermore, the effect of novelty is greater for control animals [Novelty effect control vs Cre: unpaired t-test t=2.22 p=.044].
F-H) For control but not Cre animals, cells that are reactivated during HSEs have higher trial by trial correlation than cells that are not reactivated. This effect is greater in novel trials.
F) Difference in trial-by-trial spatial rate map correlation between reactivated and non-reactivated cells for control animals in familiar and novel trials. Data shown as across animal mean.
G) Same as (J) for Cre animals.
H) Average difference in trial-by-trial correlation between reactivated and non-reactivated cells. Each point is the average difference in correlation for each mouse (dots - familiar trials, “x”- novel trials, black - control, red - Cre). Reactivated cells in control animals have higher trial x trial correlation than non-reactivated cells for both familiar (one-sample t-test: t=4.46 p=.006, all p-values Holm-corrected for multiple comparisons) and novel trials (one-sample t-test: t=5.44 p=6.12×10⁻⁵). In Cre animals, reactivated cells do not have higher trial x trial correlation than non-reactivated cells for either trial type (Holm-corrected p>.05). The increase in trial-by-trial correlation for reactivated cells is greater for control animals than Cre animals. This increase in stability of the neural representation is larger for novel trials than familiar trials [N=9 control mice, 7 Cre mice. Mixed effects ANOVA: virus main effect F(1,14)=25.9 p=1.66×10⁻⁴, familiar vs novel main effect F(1,14)=20.5 p=4.76×10⁻⁴, interaction F(1,14)=4.47 p=0.053].
See also Figure S9.

