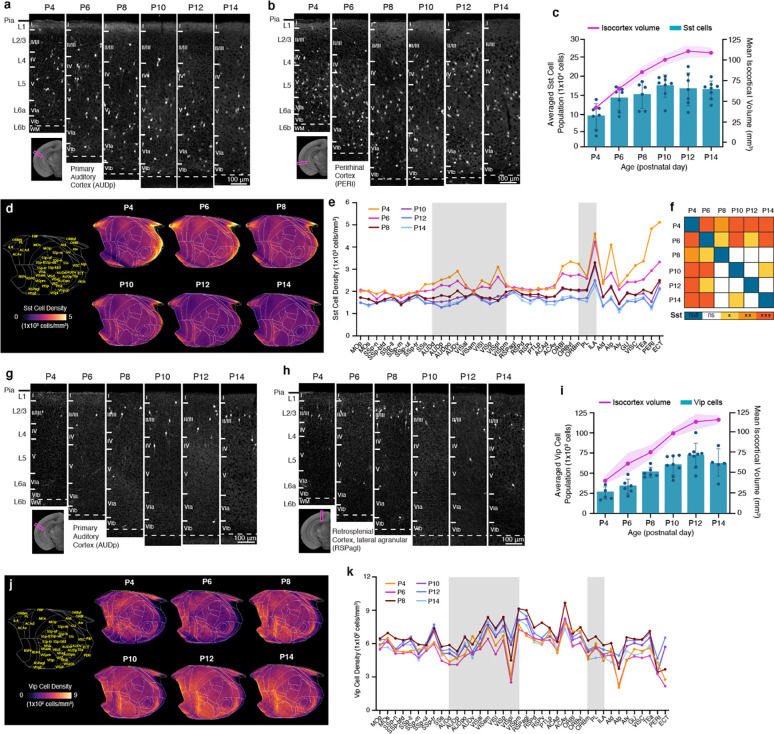
Figure 4. Cortical GABAergic cell types undergo differential developmental trajectories.
a-b, Representative STPT images of Sst cells in the (a) primary auditory cortex (AUDp) and (b) perirhinal cortex (PERI). c, Temporal trajectory of Sst cell count vs. volume in the isocortex. d, Isocortical flatmaps of Sst cell densities. e, Averaged Sst cell density across isocortical areas. f, Statistical analysis to examine significant differences between density patterns of isocortical Sst cells. g-h, Representative STPT images of Vip cells in the (g) primary auditory cortex (AUDp) and (h) retrosplenial cortex, agranular area (RSPagl). i, Temporal trajectory of Vip cell count vs. volume. j, Isocortical flatmaps of Vip cell densities. k, Averaged Vip cell density (cells/mm3) patterns across isocortical areas. Data in Fig. 4c and 4i, are reported as mean ± s.d. (includes shaded area between error bars). See Extended Data Tables 4 and 5 for cell counts, density, volume measurements and abbreviations for Sst and Vip cells, respectively.

