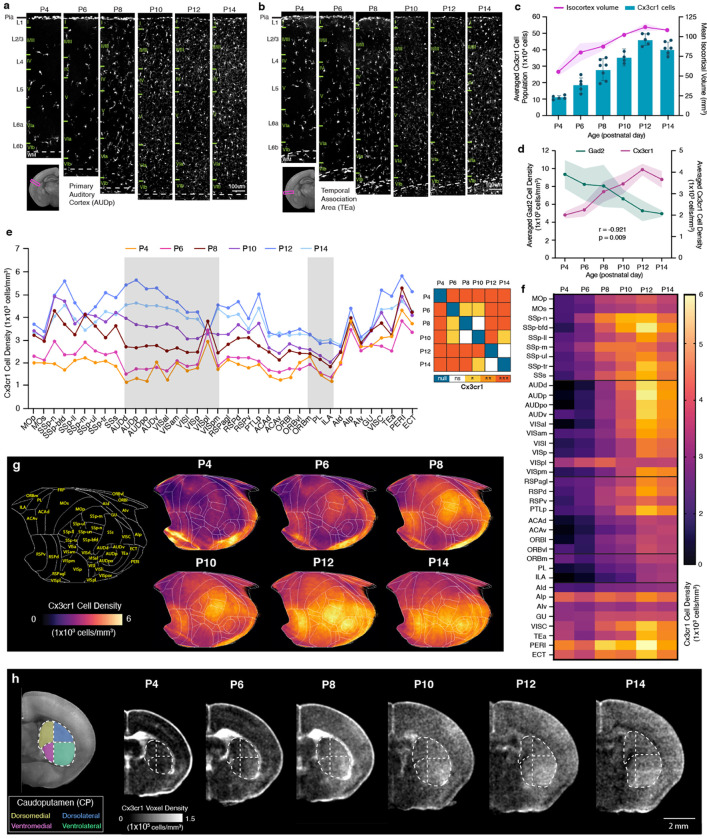
Figure 6. Cortical microglial expansion during early postnatal development.
a-b, Representative STPT images of Cx3cr1 microglia in the (a) primary auditory cortex (AUDp) and (b) temporal association cortex (TEa). c, Temporal trajectory of Cx3cr1 microglial count vs. volume. d, Microglial (Cx3cr1) and GABAergic (Gad2) cell density trajectories between P4 and P14 are significantly anti-correlated. e, (left) Averaged Cx3cr1 microglial density patterns across isocortical areas. (right) Statistical analysis to examine significant differences between density patterns of isocortical microglia. f, Isocortical flatmaps of Cx3cr1 microglial densities. g, Heatmap of Cx3cr1 microglial densities. h, Striatal divisions of the caudoputamen (CP) into four functional domains (dorsomedial, yellow; dorsolateral, blue; ventromedial, magenta; ventrolateral, green) show a distinct Cx3cr1 microglial population increase in the ventrolateral CP at P4. Data in Fig. 6c–d are reported as mean ± s.d. (includes shaded area between error bars). See Extended Data Table 6 for microglial cell counts, density, volume measurements, and abbreviations.

