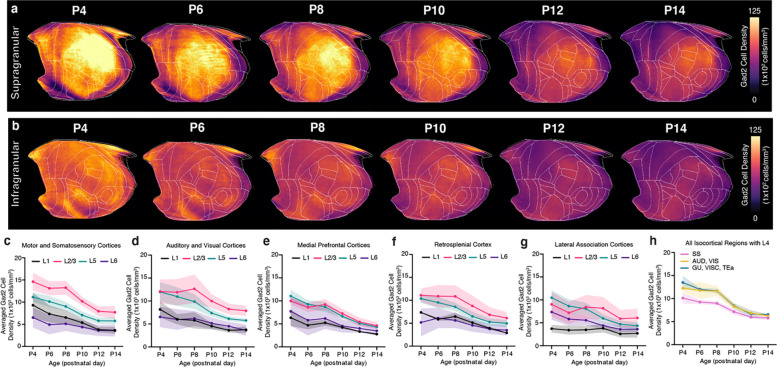
Extended Data Figure 1. Cortical layer developmental mapping of Gad2 neurons.
a-b, Isocortical flatmaps of Gad2 neuronal densities in (a) supragranular (L1, L2/3, L4) and (b) infragranular (L5, L6) cortical layers. c-g, Layer-specific trajectories of Gad2 cell density in L1, L2/3, L5, and L6 of the isocortex divided into regional subgroups based on their functional and anatomical connectivity: (c) motor and somatosensory, (d) auditory and visual,€) medial prefrontal, (f) retrosplenial, and (g) lateral association areas. h, Gad2 cell density in isocortical regions containing L4, which includes somatosensory (SS), auditory (AUD), visual (VIS), gustatory (GU), visceral (VISC), and temporal association (TEa) areas. Data are reported as mean ± s.d. (shaded area between error bars). See Extended Data Table 3 for Gad2 cell counts, density, and volume measurements.

