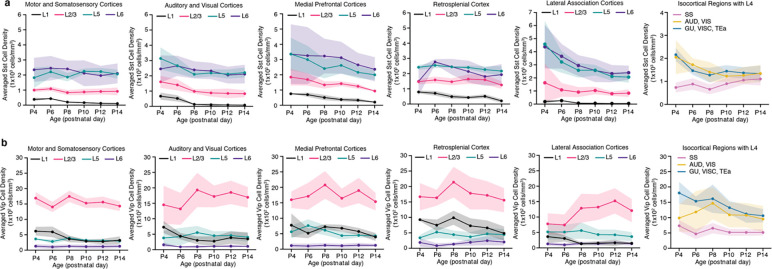
Extended Data Figure 2. Cortical layer developmental mapping of Sst and Vip interneurons.
a-b, Layer-specific trajectories of (a) Sst cell density and (b) Vip cell density in the isocortical areas. Data are reported as mean ± s.d. (shaded area between error bars). See Extended Data Tables 4 and 5 for cell counts, density, and volume measurements for Sst and Vip interneurons, respectively.

