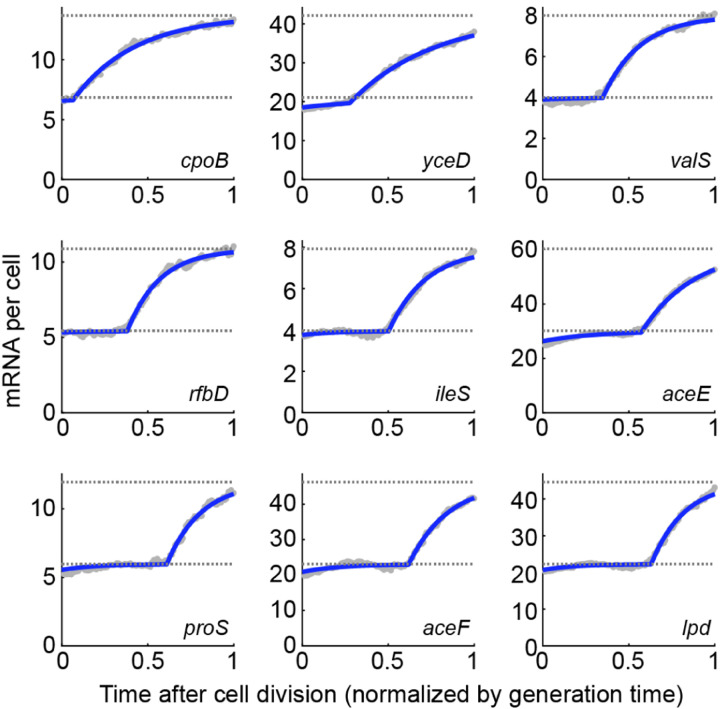
FIG. 10.
Single-cell RNA sequencing (scRNA-seq) analysis reveals an mRNA-follows-dosage pattern across multiple E. coli genes. scRNA-seq expression, converted to mRNA copy-number, is plotted against cell age. Horizontal dotted lines indicate the expected steady-states levels before and after gene replication. Blue line, fit to Equation 16. Data from (Pountain et al., 2022). Additional analysis by Kevin McDonald and Tianyou Yao.

