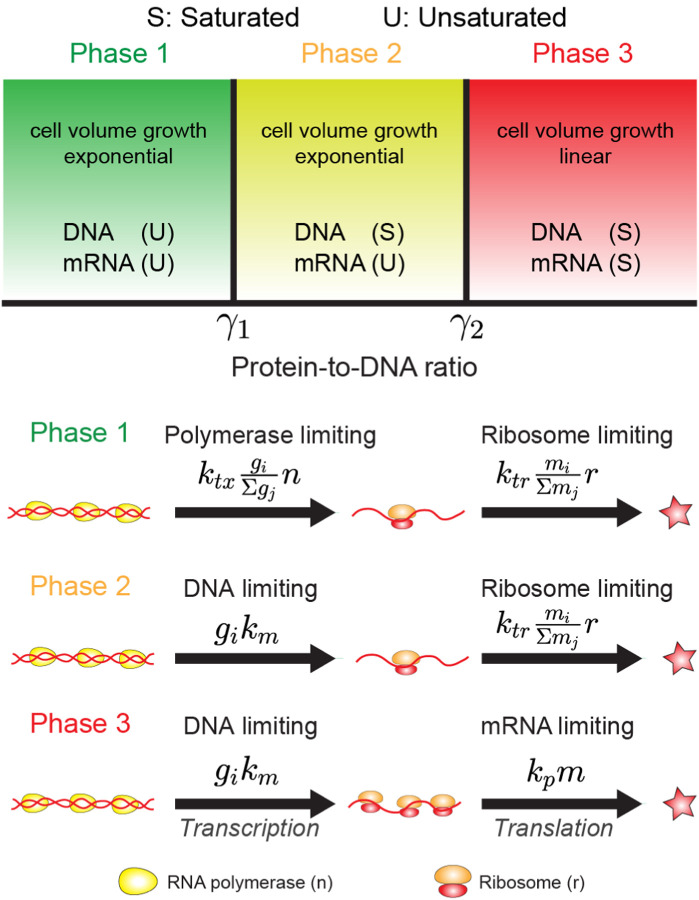
FIG. 15.
The different phases of the continuous growth model. The figure shows, schematically, the three phases of the model, where protein and mRNA production rates are limited by different resources: transcription is limited by RNAP number or by the DNA template, and translation is limited by ribosome number or by the mRNA numbers. The reaction rates listed in the bottom panel refer to the protein and mRNA concentrations rather than copy numbers. Adapted from (Lin and Amir, 2018), and reproduced with permission.

