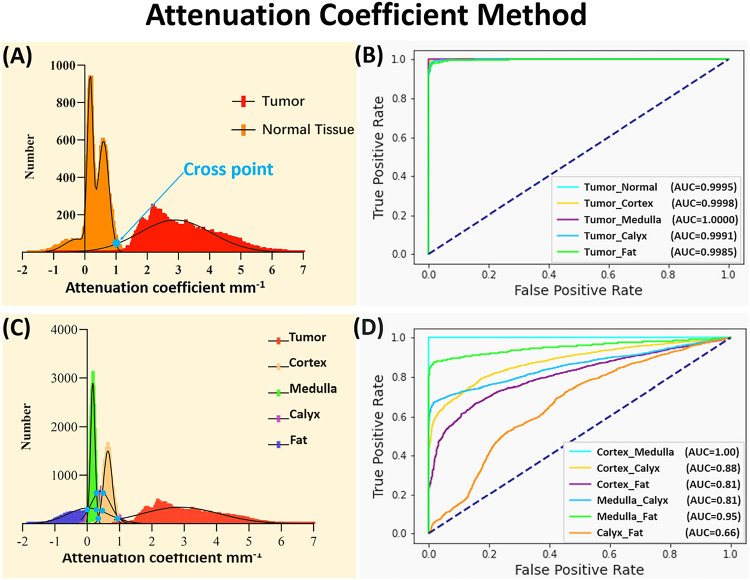
Figure 3.
(A) Attenuation coefficient distribution results between normal tissue and tumor tissue. (B) ROC curves of the classification with attenuation coefficient between tumor tissue and other tissues. (C) Attenuation coefficient distribution results of all five tissue types. (D) ROC curves of the classification with attenuation coefficient among different normal tissues.

