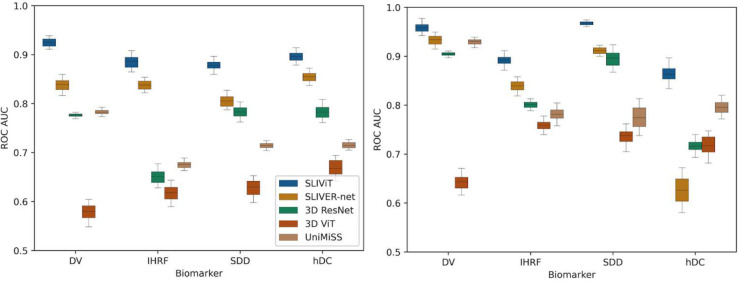
Figure 3 |. ROC AUC performance comparison of five models in four independent AMD-biomarker classification tasks when trained on less than 700 OCT volumes.
Shown are the ROC AUC scores of SLIViT (blue), SLIVER-net (orange), 3D ResNet (green), 3D ViT (red), and UniMiSS (brown) on four single-task classification problems of AMD high-risk factors in two independent volumetric-OCT datasets. The expected performance of a naive classifier is 0.5. The left panel shows the performance when trained and tested on the Houston Dataset. The right panel shows the performance when trained on the Houston Dataset and tested on the SLIVER-net Dataset (see Table S1A). Box plot whiskers represent a 90% CI.

