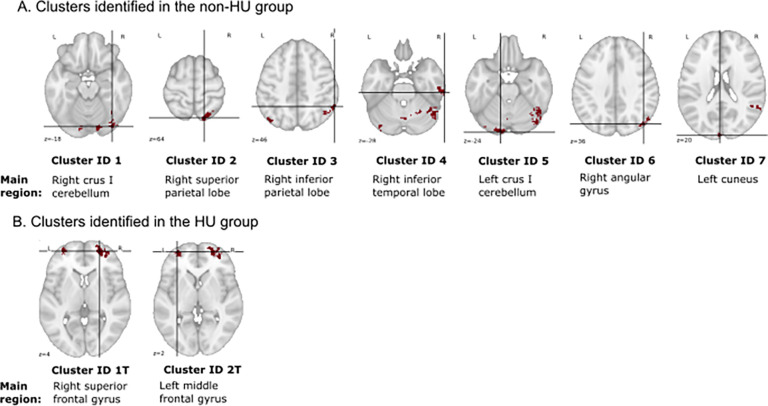
Figure 6.
Anatomical locations of the 9 selected clusters (with peak value ≥ .7 and volume ≥ 520 mm3) at the transverse plane and their respective main regions in the brain (the highest percentage % coverage in AAL). The details of these clusters are reported in Tables 1 and 2. The crossed lines marked the peaks of the clusters.

