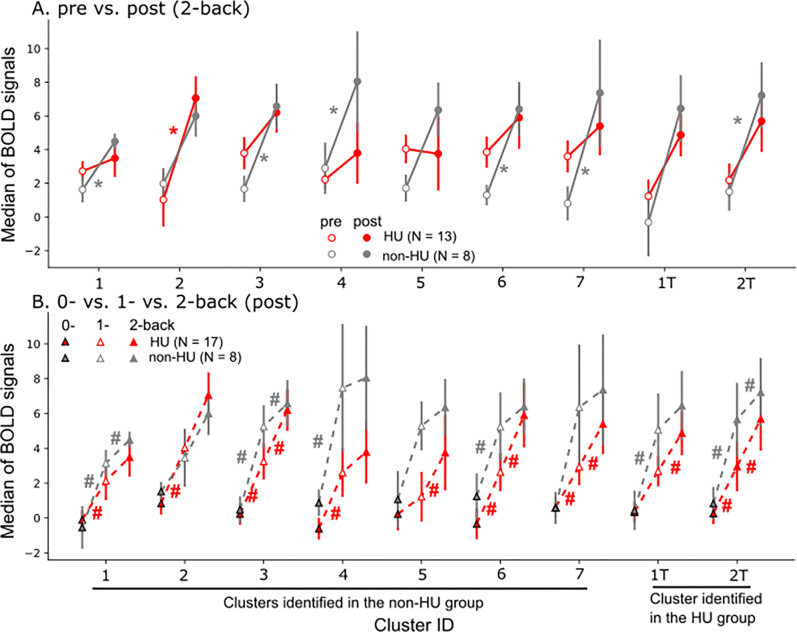
Figure 7.
Increased BOLD signals during working memory processing as a function of time points and task difficulty. Nine clusters (refer to Fig. 6, Tables 1 & 2) were selected from all the clusters identified via searchlight analyses. (A) Six selected clusters in the non-HU control group had higher brain activation during working memory processing at 1-year follow-up (post) compared to pre-treatment. However, only one selected cluster had higher brain activation in the HU group at 1-year follow-up compared to pre-treatment. * p < .05 [Wilcoxon signed-rank test within the HU group (red) or the non-HU group (gray)]. (B) Increased BOLD signals were observed in most selected clusters in both groups as the working memory load increased from 0- to 1-back. In the non-HU control group, BOLD signals did not increase further when the working memory load increased from 1- to 2-back. In the HU group, however, BOLD signals increased continually as the working memory load increased from 0- to 2-back. # p < .05 (Wilcoxon signed-rank test).

