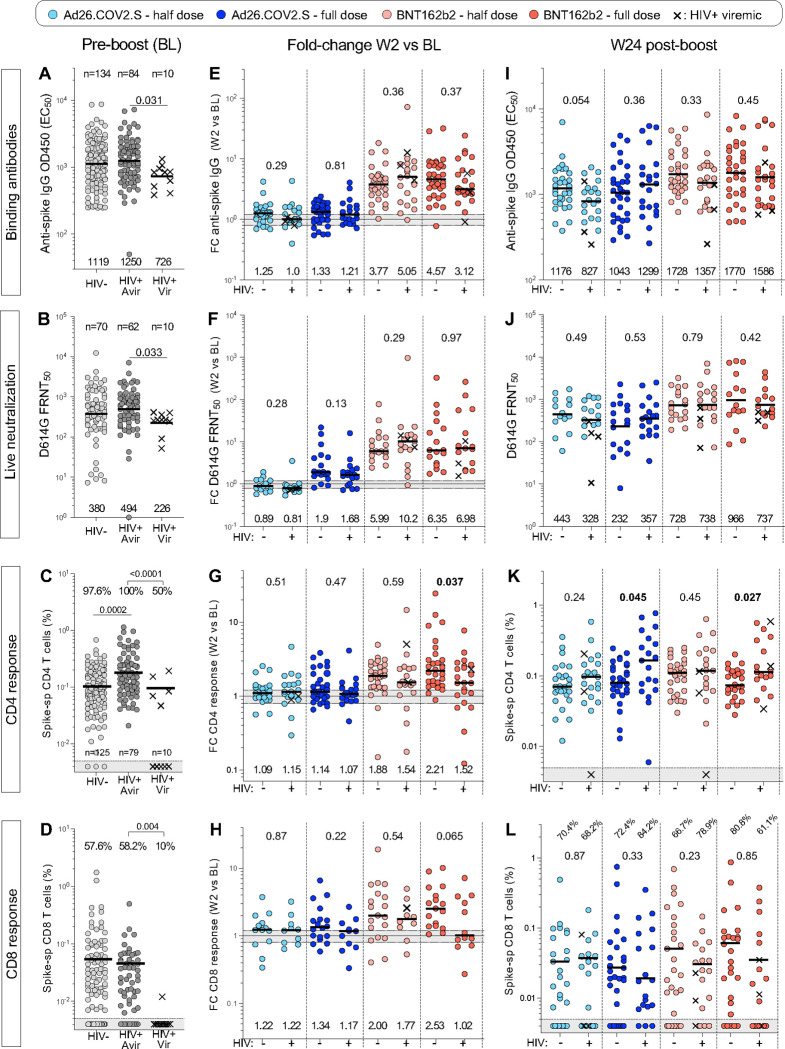
Figure 9: Humoral and cellular responses in study participants stratified by HIV status.
(A to D) Spike-specific binding antibodies (A), live neutralization activity (B), spike-specific CD4+ response (C) and spike-specific CD8+ response (D) against ancestral (D614G) SARS-CoV-2 in HIV-negative (HIV−), PLWH with a viral load <200 HIV mRNA copies/ml (HIV+ Avir) and PLWH with a viral load >200 HIV mRNA copies/ml (HIV+ Vir) before vaccine booster (BL). Bars represent GMT for A, B, I, J and medians for all other graphs. Statistical comparisons were performed using a Kruskal-Wallis test with Dunn’s corrections. The proportion of T-cell responders is indicated on top of the graph. (E to H) Fold change in spike-specific binding antibodies (E), live neutralization activity (F), spike-specific CD4+ response (G) and spike-specific CD8+ response (H) between W2 and BL in each study arm, stratified by HIV status. (I to L) Spike-specific binding antibodies (I), live neutralization activity (J), spike-specific CD4+ response (K) and spike-specific CD8+ response (L) against ancestral (D614G) SARS-CoV-2 at W24 after vaccine booster. Viremic PLWH are identified with a cross. Bars represent medians. Statistical comparisons between PLWH and HIV-negative groups were performed using a Mann-Whitney test.

