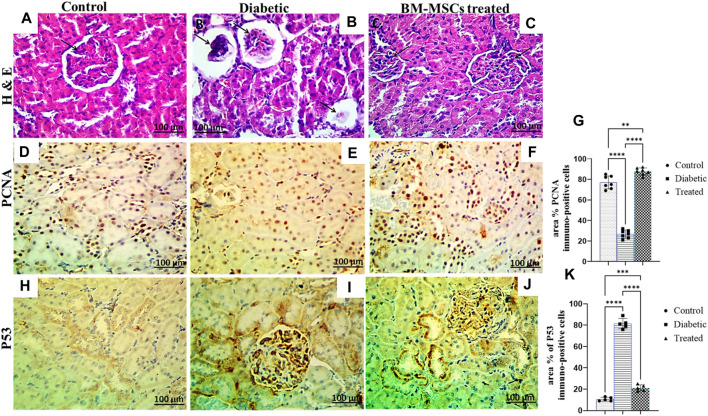
FIGURE 7.
Effect of BM-MSC administration on renal histological characteristics (H&E-stained sections) and the immunohistochemical staining of PCNA and P53, as indicated by a +ve immune reaction (A–K). (A) Photomicrograph of a renal cross-section stained by H&E (×400) shows a normal pattern of renal tissue in the control group, (B) photomicrograph of a renal cross-section stained by H&E (×400) shows collapsed and necrotic glomeruli with a widening of ‘Bowman’s space in the diabetic group, (C) photomicrograph of a renal cross-section stained by H&E (×400) shows a structured renal architecture in the BM-MSC-treated group compared to the normal control group, (D) photomicrograph of a renal cross-section immunostained with PCNA in the control group, (E) photomicrograph of a renal cross-section immunostained with PCNA in the diabetic group, (F) photomicrograph of a renal cross-section immunostained with PCNA in the BM-MSC-treated group, (G) PCNA immunostaining intensity (percent area), (H) photomicrograph of a renal cross-section immunostained with P53 in the control group, (I) photomicrograph of a renal cross-section immunostained with P53 in the diabetic group, (J) photomicrograph of a renal cross-section immunostained with P53 in the BM-MSC-treated group, and (K) P53 immunostaining intensity (percent area). Values represent mean ± SEM of 10 rats per group. *p < 0.05, **p < 0.01, ***p < 0.001, and ****p < 0.0001.

