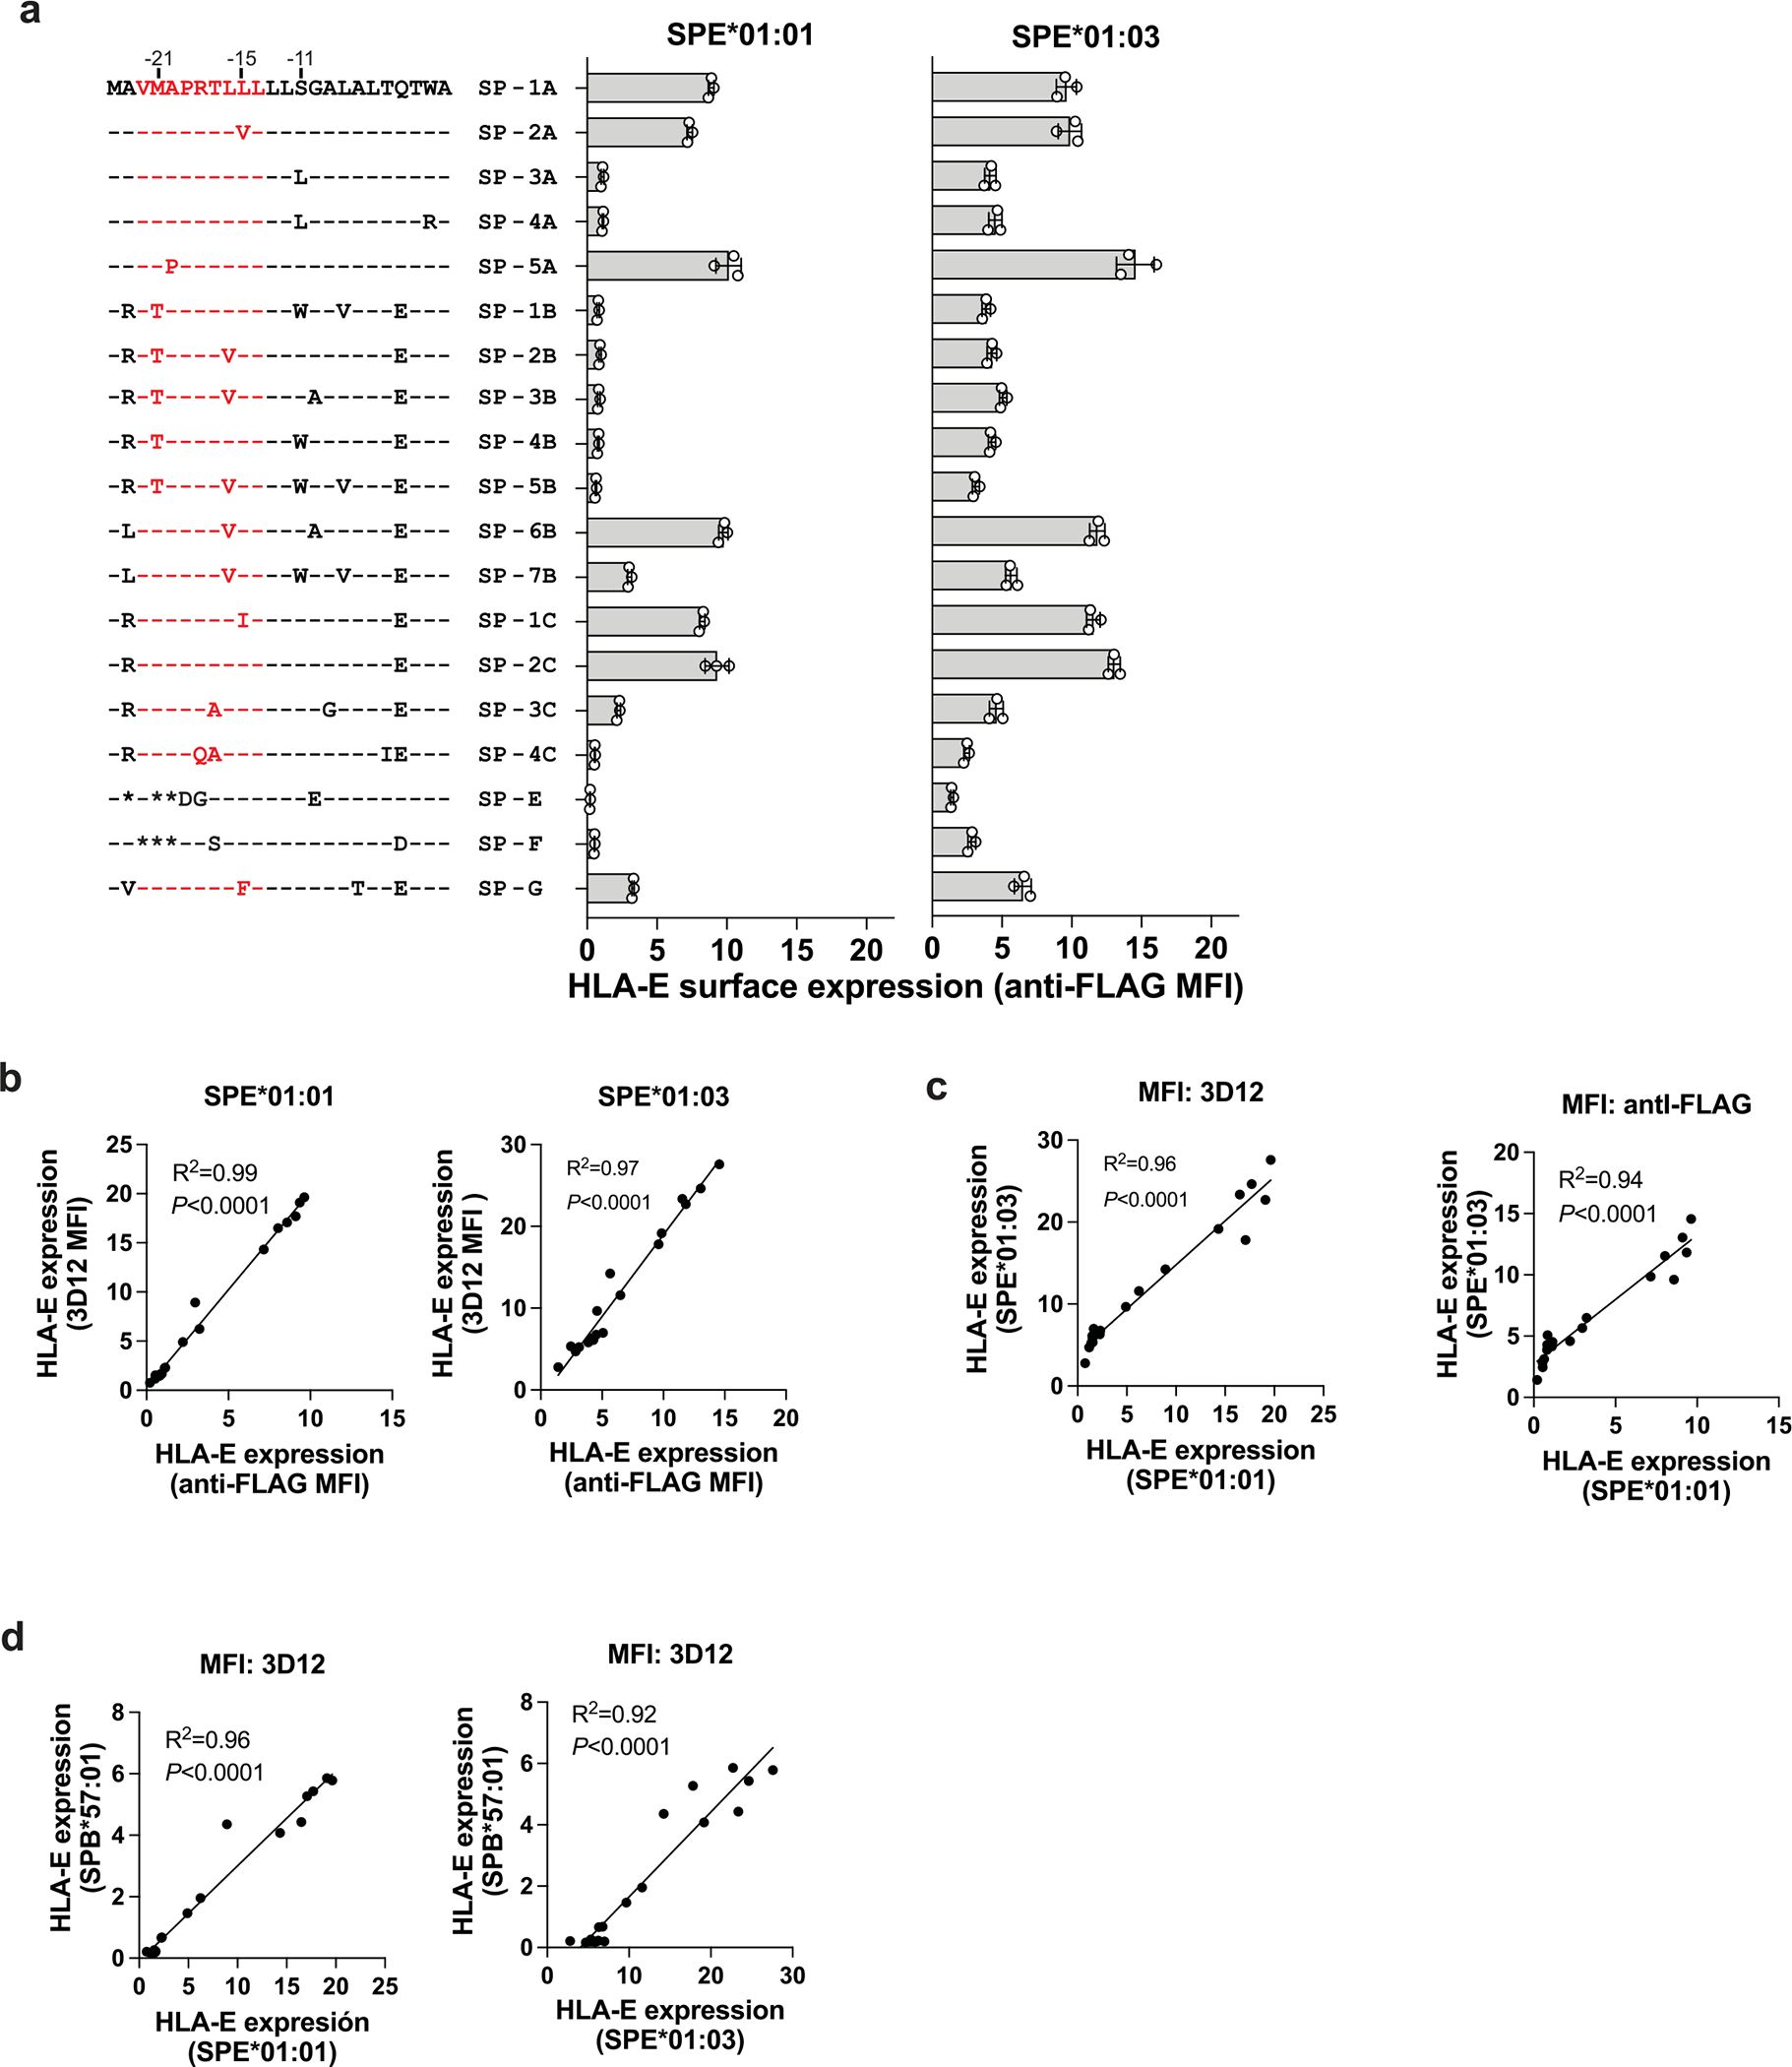
Extended Data Fig. 3 |. Differential HLA-E expression on the surface of .221-SPE cells and correlations of HLA-E expression levels between pairs of distinct measurements.

a, Cell surface expression levels of HLA-E on .221-SPE*01:01 and .221-SPE*01:03 cells measured by flow cytometry using anti-FLAG antibody. Data represent measurements on different days (n = 3). Error bars represent the mean ± SD. Amino acid sequence alignments of corresponding SP variants are shown on the left. VL9 peptide is shown in red. b, Correlations between HLA-E expression levels measured using anti-FLAG antibody and those measured using 3D12 antibody on the surface of .221-SPE*01:01 or .221-SPE*01:03 cells. c, Correlations between HLA-E expression levels on .221-SPE*01:01 cells and those on .221-SPE*01:03 cells measured using 3D12 or anti-FLAG antibodies. d, Correlations of HLA-E expression levels on .221-SPB*57:01 and those on .221-SPE*01:01 or .221-SPE*01:03. b-d, R2 was determined by Spearman correlation analysis and is shown with a two-tailed P value.
