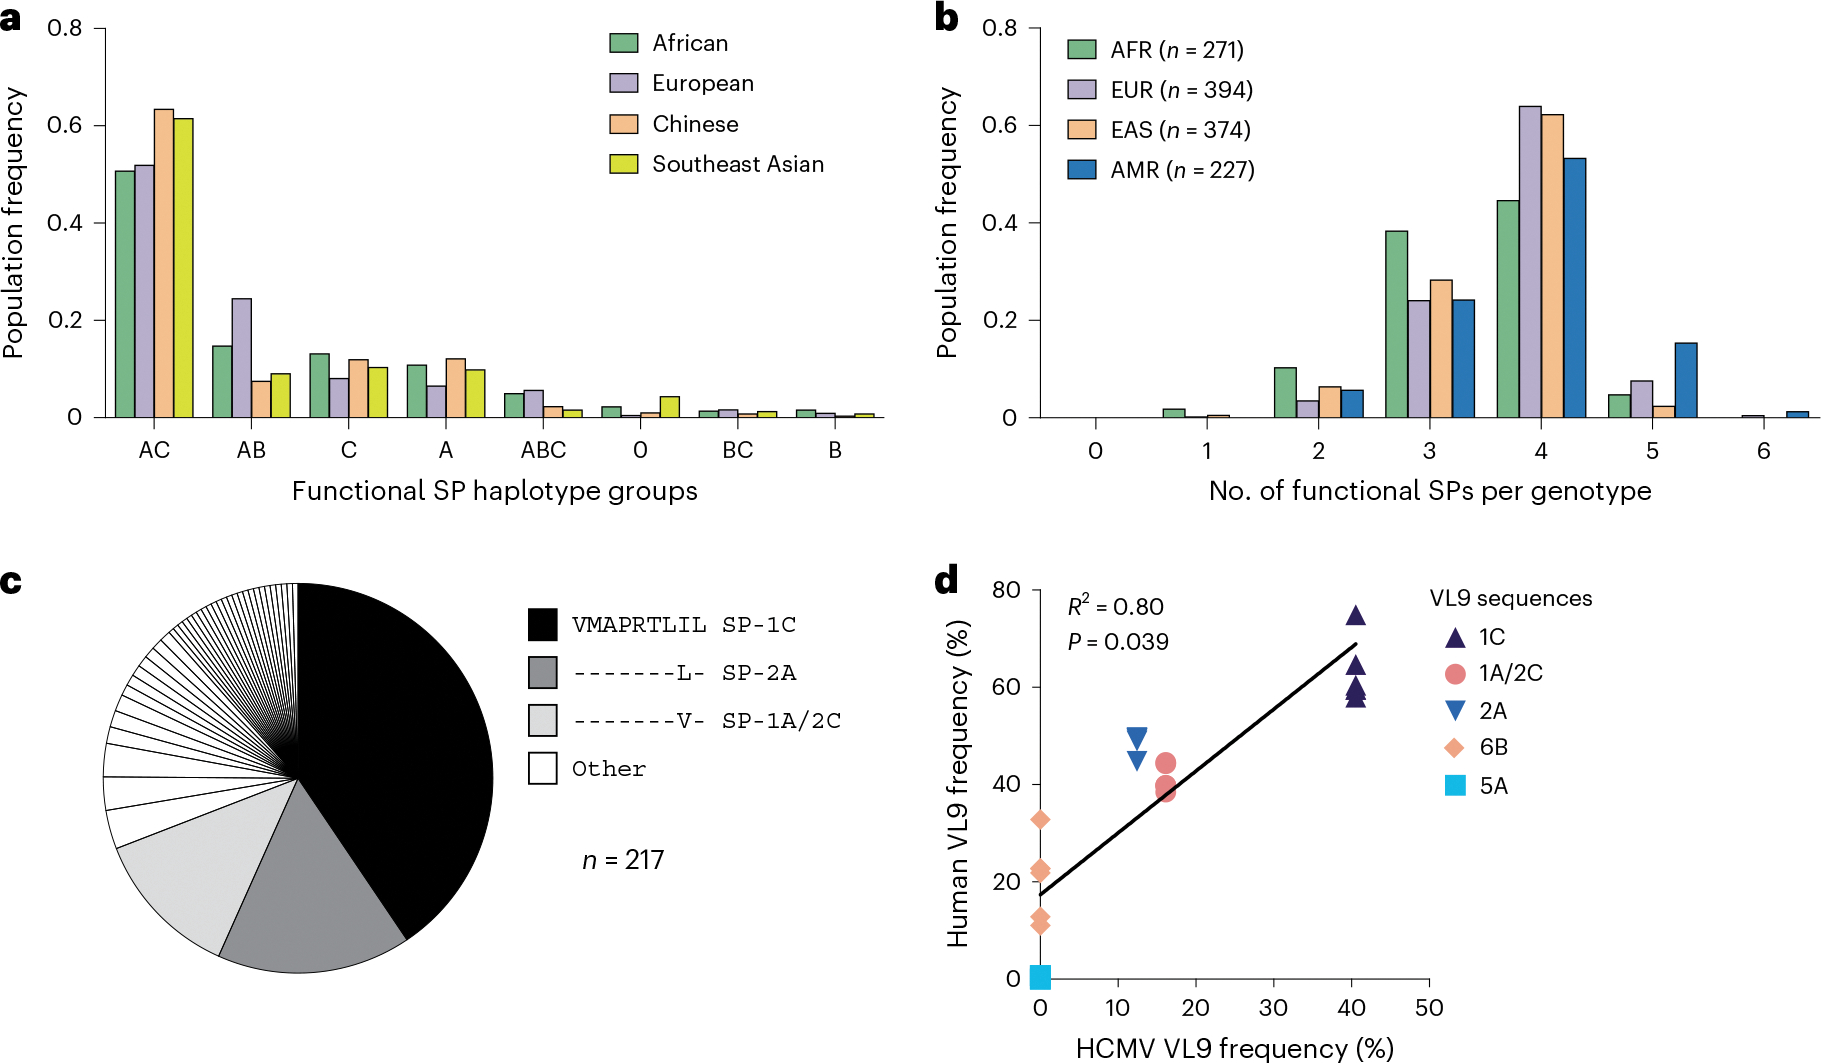
Fig. 5 |. HLA-A, HLA-B and HLA-C haplotypes and genotypes stratified by the presence of alleles encoding functional signal peptides.

a, Frequencies of HLA class I haplotype groups that encode 0–3 functional SPs in four NMDP populations. Classical HLA class I haplotypes were analyzed for the presence of alleles encoding functional SPs. Labels represent loci providing functional SPs. 0 indicates no functional SPs on the haplotype. b, Distribution of HLA-A, HLA-B and HLA-C genotypes containing different numbers of functional SPs in four populations from the 1000 Genomes Project genotyped for HLA class I. AFR, Africans; AMR, Admixed Americans; EAS, East Asians; EUR, Europeans. c, Distribution of HCMV VL9 mimics in the dataset reported previously17. The legend lists the three major VL9 mimic sequences corresponding to the functional SPs shown. d, Correlation between the frequencies of HCMV VL9 variants (c) and the frequencies of matching functional SPs in the NMDP haplotypes (a). R2 was determined by Spearman correlation analysis based on average frequencies between the populations and is shown with a two-tailed P value.
