
Extended Data Fig. 2 |. Differential binding of VL9 peptides to HLA-E.
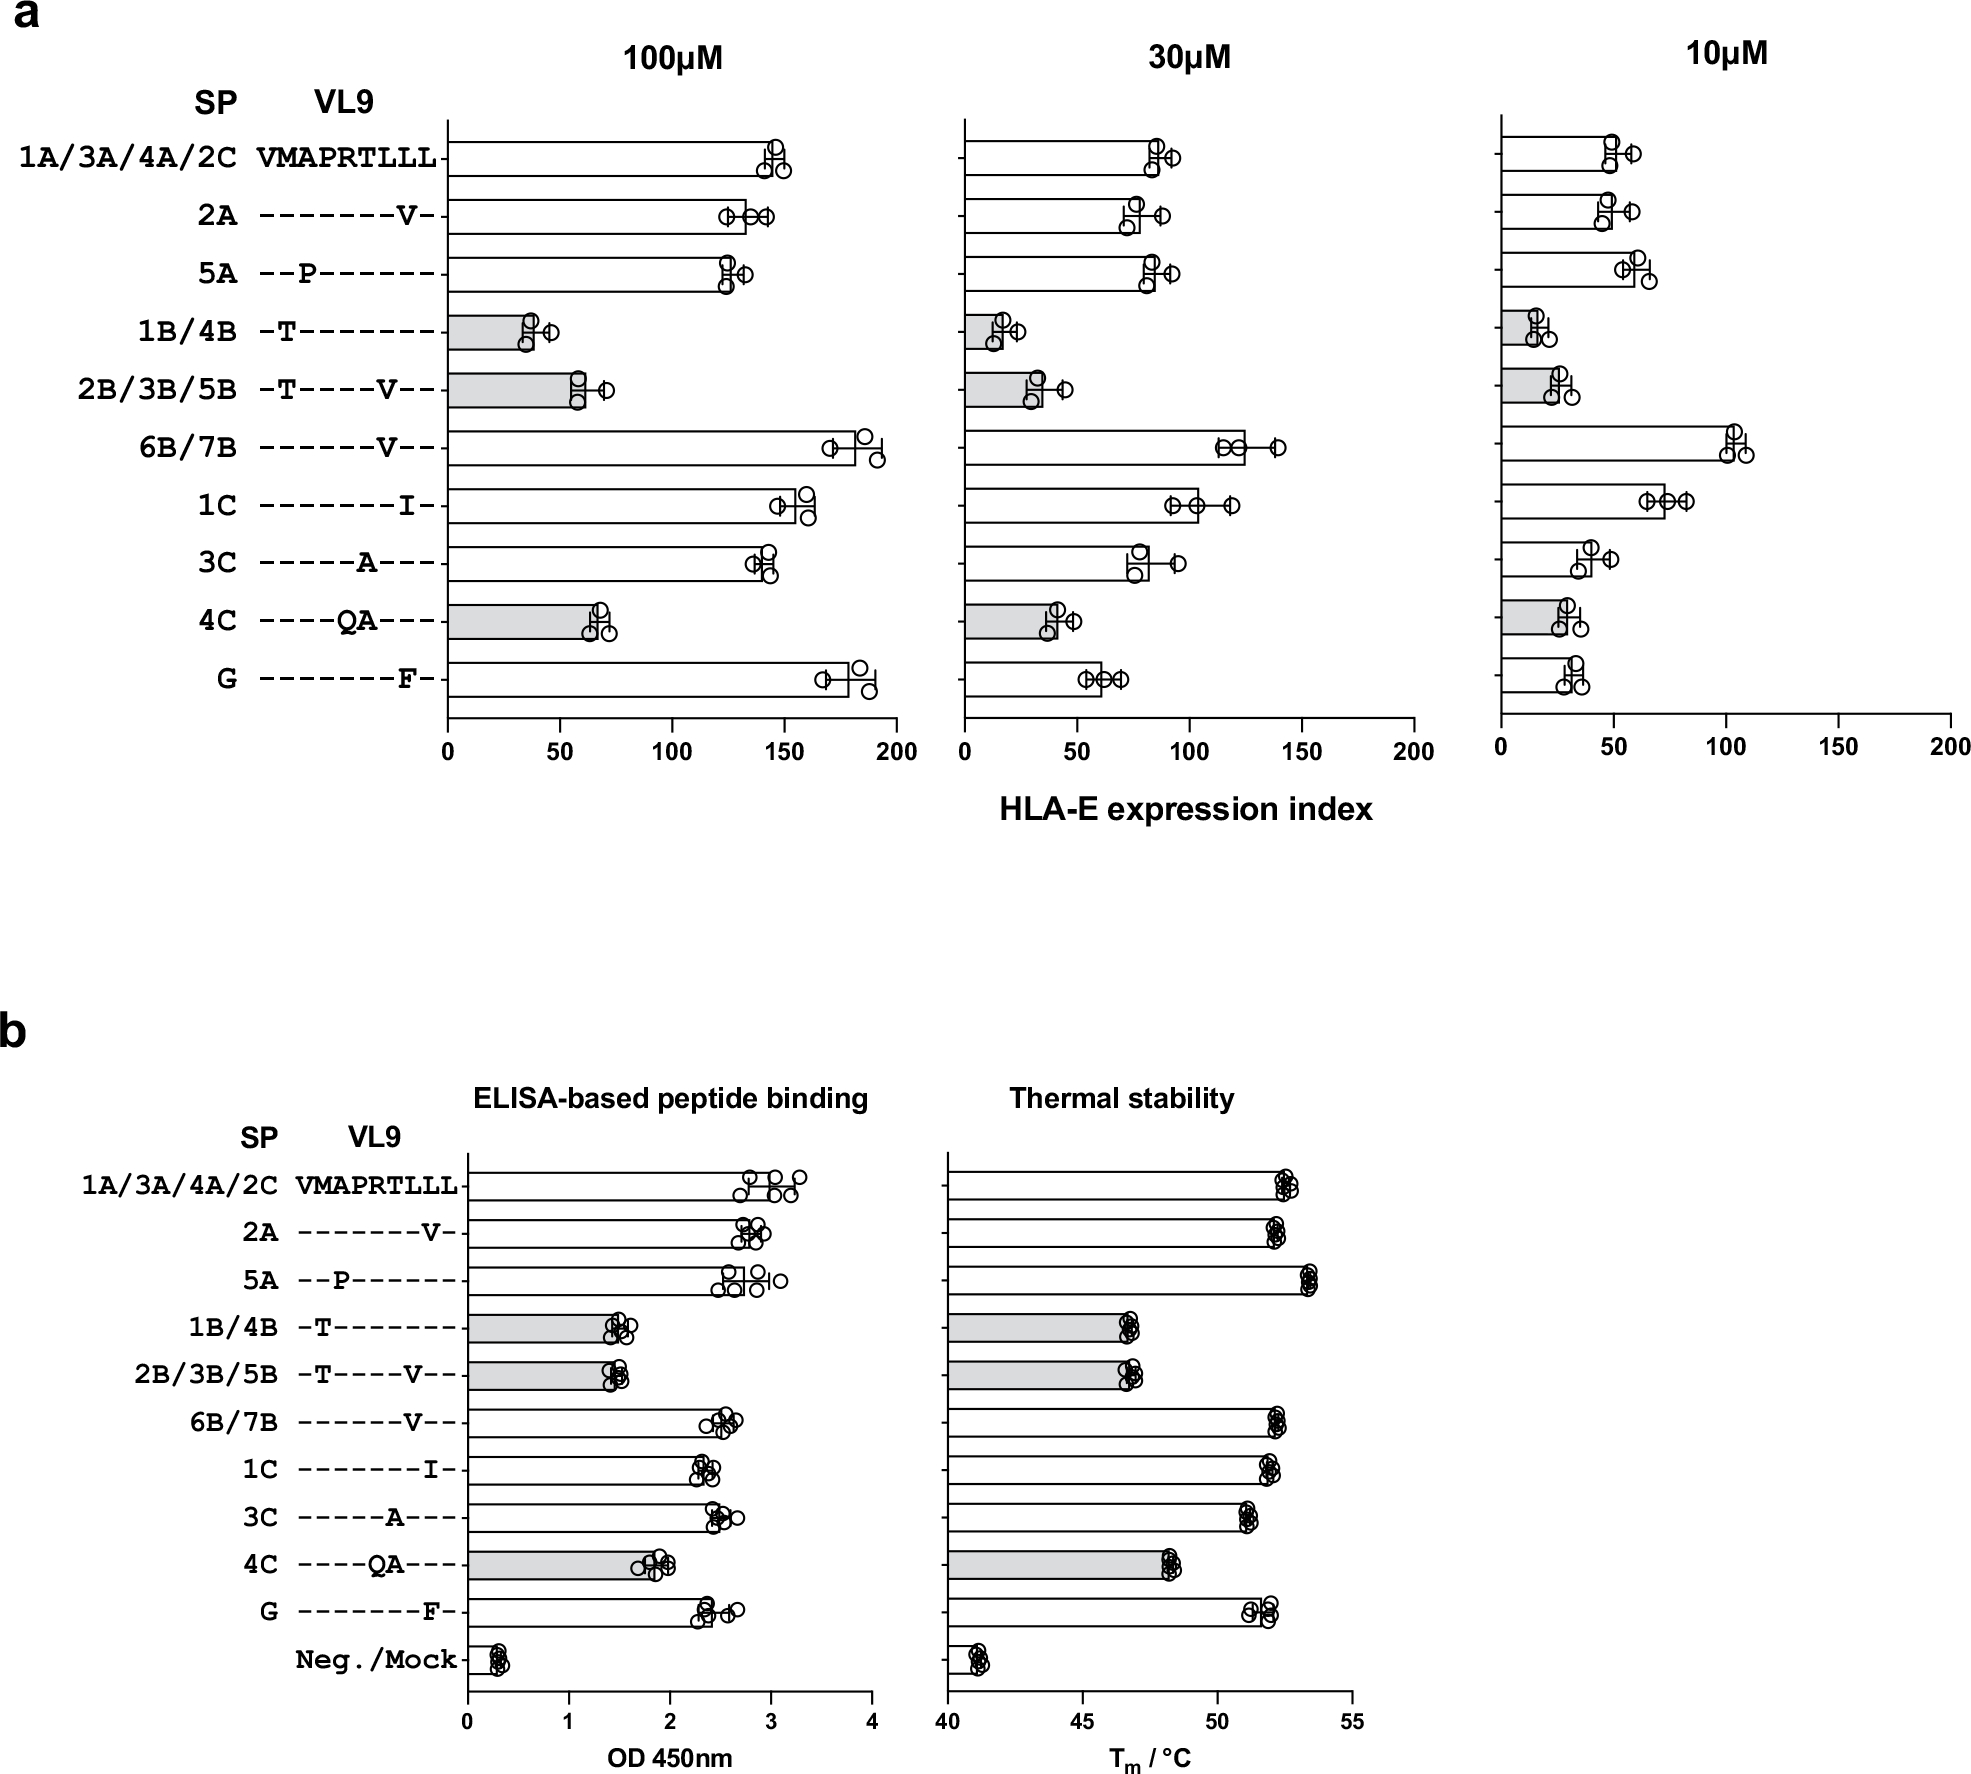
a, HLA-E surface expression level on VL9-pulsed .221 cells measured by flow cytometry using 3D12 antibody. Cells were pulsed with peptides at 100, 30, and 10 μM concentrations. Peptide sequence alignments labeled with the corresponding SP variants are shown on the left. The expression index was calculated using 3D12 MFI as follows: ((sample − neg_ctrl) ÷ (pos_ctrl − neg_ctrl)) × 100, where neg_ctrl represents unpulsed .221 cells mixed with DMSO and pos_ctrl represents unpulsed .221 cells incubated constantly at 26 °C. Data represent triplicate experiments and reflect endogenous HLA-E*01:01 expression. b, VL9 binding to HLA-E*01:03 estimated using ELISA-based peptide binding and thermal stability assays. Bar charts represent absorbance signals at 450 nm reflecting the degree of VL9HLA-E complex recovery in the sandwich ELISA assay and thermal melting temperatures of VL9HLA-E determined using differential scanning fluorimetry. Data represent six experiments. a, b, Light gray bars depict the three peptides that showed the lowest binding levels consistently across experiments. Error bars represent the mean ± SD.