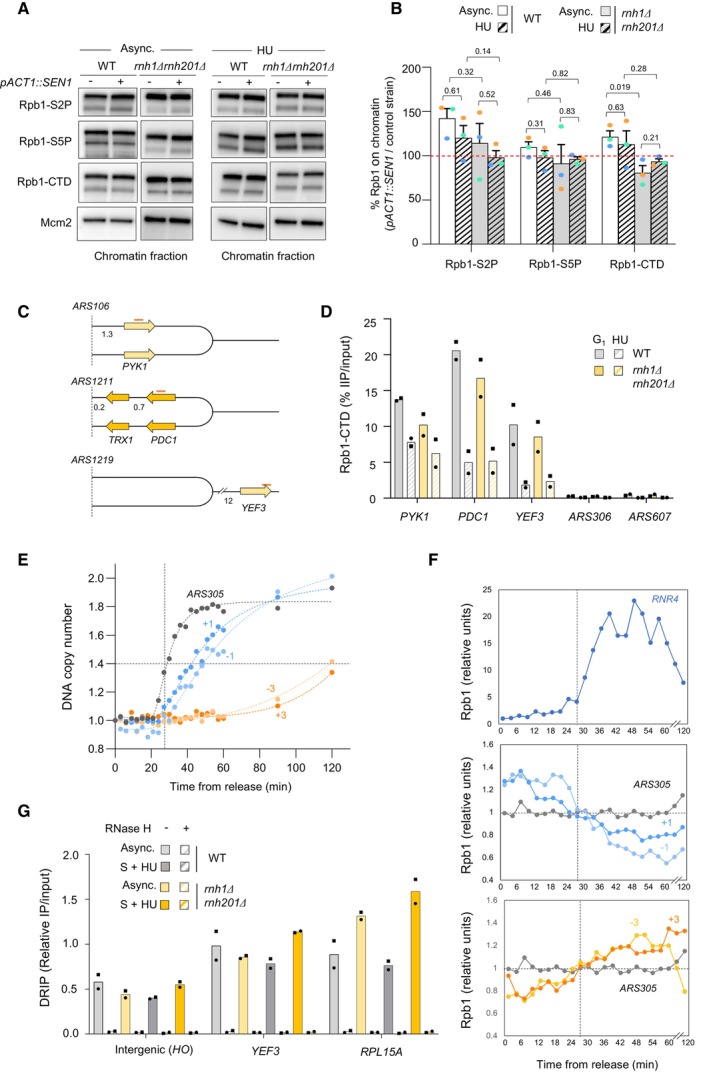
Chromatin‐bound proteins from cells in indicated phases of the cell cycle were prepared and subjected to SDS–PAGE and immunoblotting with the indicated antibodies in a wild‐type strain that either does or does not overexpress
SEN1 (Table
EV1).
Quantification of chromatin‐bound Rpb1‐S2P, Rpb1‐S5P and Rpb1‐CTD from data shown in panel F. Mcm2 is used as a loading control. Mean and SEM are indicated (n = 3 biological replicates). P‐values are indicated (paired t‐tests).
Schematic representation of the genes exhibiting transcription‐replication conflicts.
ChIP‐qPCR analysis comparing Rpb1‐CTD enrichment in G1‐arrested versus HU‐arrested cells (60 min, 0.2 M). Rpb1‐CTD occupancy is expressed as percentage of input DNA. Data are expressed as individual data points. Mean is indicated (n = 2 biological replicates).
Variation of DNA copy number around the early origin ARS305 in wild type cells released synchronously into S phase after an α‐factor arrest in medium containing 200 mM HU. Samples were collected every 3 min. DNA copy number was quantified by qPCR at ARS305 and 4 other loci located at +1, +3, −1 and −3 kb from ARS305.
ChIP‐qPCR of Rpb1‐CTD enrichment in cells collected in the experiment described in panel (E). Rpb1‐CTD occupancy is expressed as percentage of input DNA.
DRIP‐qPCR analysis of RNA:DNA hybrid enrichment at an intergenic locus (HO) and two active genes (YEF3 and RPL15A) in wild type and rnh1Δ rnh201Δ cells ± in vitro RNase H treatment. Data are expressed as a percentage of input. Individual points are indicated (n = 2 biological replicates).

