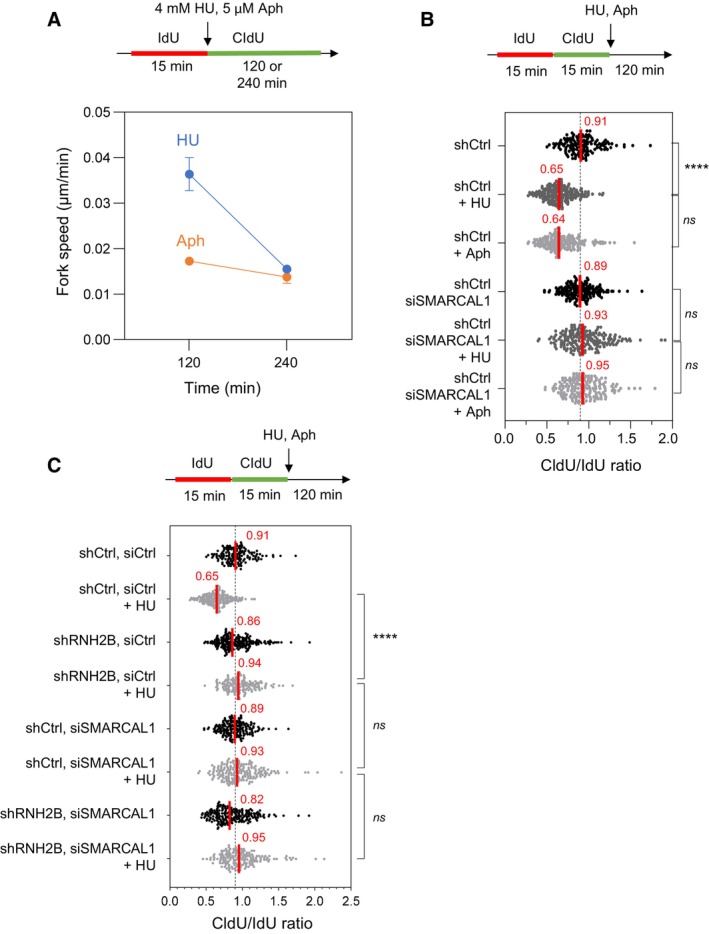
Figure EV5. Effect of aphidicolin and hydroxyurea on fork velocity and on the resection of nascent DNA.

- HeLa cells were labeled for 15 min with IdU and for 120 or 240 min with CldU in the presence of 4 mM hydroxyurea (HU) or 5 μM aphidicolin (Aph). DNA fibers were stretched on glass slides and the length of CldU tracks were measured. Fork speed was calculated during the first 120 min after HU addition and between 120 and 240 min. Mean and SEM are shown for two independent experiments.
- HeLa cells were transfected with siRNA against SMARCAL1 or a control sequence (siCtrl) for 48 h. They were sequentially labeled for 15 min with IdU and for 15 min with CldU. Then, they were treated for 2 h with 4 mM hydroxyurea (HU) or 5 μM aphidicolin (Aph) before DNA fiber analysis. The lengths of the IdU and CldU tracks were plotted as the ratio of CldU to IdU. Median CldU/IdU ratios are indicated in red. ****P < 0.0001; ns, non‐significant, Mann–Whitney rank‐sum test (n = 2 biological replicates).
- DNA fiber analysis of fork resection in control HeLa cells (shCtrl) and in HeLa cells depleted for RNase H2B (shRNH2B) and transfected with siRNA against SMARCAL1 or a control sequence (siCtrl), and exposed or not to 4 mM HU. Cells were treated with doxycycline (10 μg/ml) for 24 h and were then transfected with siRNAs for 48 h in the presence of doxycycline. Cells were sequentially labeled for 15 min with IdU and for 15 min with CldU. Then, they were either collected immediately or treated for 2 h with 4 mM hydroxyurea (HU) before DNA fiber analysis. The lengths of the IdU and CldU tracks were plotted as the ratio of CldU to IdU. Median CldU/IdU ratios are indicated in red. ****P < 0.0001; ns, non‐significant, Mann–Whitney rank‐sum test (n = 2 biological replicates).
