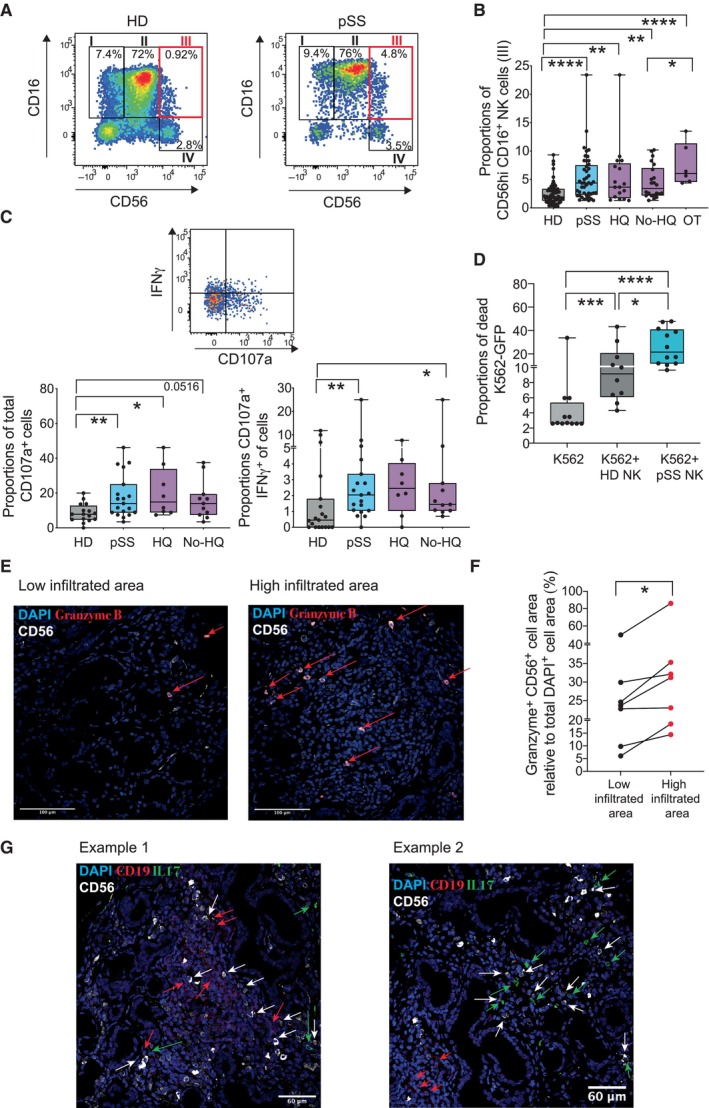
Figure 1. Proportions and phenotypical characteristics of natural killer cell subsets from pSS patients.

-
AFlow cytometry dot plots showing analysis of NK cell subsets present in Lineage (CD3, CD19, CD14) negative, HLADR negative lymphocytes, and defined by CD16 vs. CD56 expression in the PB of a representative HD (left) and pSS (right) individuals. Gating defining CD56hi CD16+ NK cells (III) is highlighted in red.
-
BSummarized proportions of CD56hi CD16+ circulating NK cells in 56 healthy donors (HD; gray) and total 48 primary Sjögren's syndrome (pSS; blue) patients or stratified according to the absence (No HQ, n = 25 biological replicates) or the presence of hydroxychloroquine (HQ; n = 17 biological replicates) or other (OT; n = 6 biological replicates) treatments (purple).
-
CAnalysis of expression of IFNγ and CD107a on NK cells. Representative flow cytometry dot plot is included in the top. Proportions of total CD107a+ (bottom, left) and IFNγ+ CD107a+ (bottom, right) cells within the CD56hi CD16+ NK cell subset from n = 16 HD (gray) and n = 19 total or n = 8 HQ and n = 11 No‐HQ pSS patients (blue).
-
DFunctional characteristics of NK cells from pSS patients. Summary of proportions of dead target K562‐GFP cells cultured for 16 h in the absence (light gray) or the presence of isolated circulating NK cells from HD (n = 10; biological replicates) or pSS (n = 12 biological replicates) patients.
-
E–GHistological immunofluorescence analysis of merged expression of CD56 (white) and Granzyme B (red) on low (left) and highly (right) infiltrated glandular areas (E) or with CD19 (red) and IL‐17 (green) (G) from the section of SG tissue from a representative pSS patient. Cell nuclei were stained with DAPI (blue). Cells co‐expressing CD56 and Granzyme B (E) or expressing CD19 (G) are highlighted with red arrows. In panel (G), IL17+ and CD56+ are also highlighted in green and white arrows, respectively. Original magnification 40×. (F): Image J quantification of proportions of area of CD56+ NK cells co‐expressing Granzyme B within the total the mentioned total high and low infiltrated areas from n = 7 tested pSS patients. Data are normalized to the number of total DAPI+ cells detected on each area considered as 100%.
Data information: (B–D) Data are represented as box and whiskers plots with maximum and minimum range and a median value central band. Statistical significance was calculated with a two‐tailed Mann Whitney test. *P < 0.05; **P < 0.01; ***P < 0.001; ****P < 0.0001.
Source data are available online for this figure.
