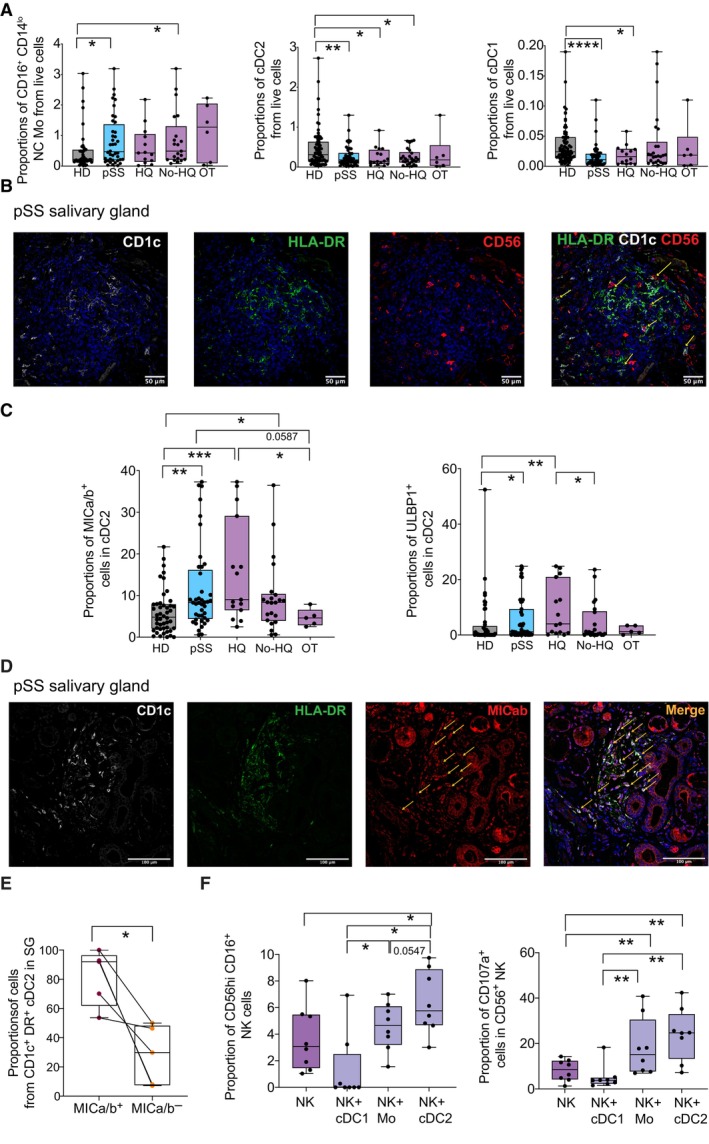
Figure 2. Frequencies, phenotypic and functional characteristics of myeloid cell subsets from pSS patients.

-
ABox and whiskers plots showing proportions from live lymphocytes of non‐classical (NC; right) CD16+ CD14lo Mo (left), cDC2 (middle), and cDC1 (right) in the PB from HD (gray; n = 56 biological replicates) and total pSS patients (blue; n = 48: biological replicates) or stratified according to the absence (No HQ, n = 25) or the presence of hydroxychloroquine (HQ; n = 17) or other (OT; n = 6) treatments (purple).
-
BRepresentative confocal microscopy (40× magnification) showing immunofluorescence analysis of CD1c (white), HLADR (green), and CD56 (red) expression on an SG tissue section from a representative pSS patient. Cell nuclei were stained with DAPI (blue). Cells co‐expressing CD1c and HLADR markers with close proximity to CD56 cells are highlighted with a yellow arrow.
-
CProportions of MICa/b+ and ULBP1+ cells from circulating cDC2 (left plots), cDC1 (middle plots), and CD14+ Mo (right plots) in 46 HD (gray) and total n = 42, n = 15 HQ, n = 22 No HQ, and n = 5 OT pSS patients (blue and purple).
-
DRepresentative confocal microscopy (40× magnification) showing immunofluorescence analysis of CD1c (white), HLADR (green), and MICab (red) expression on a representative SG tissue section from a pSS patient from a total of n = 4 individuals tested. Cell nuclei were stained with DAPI (blue). Cells co‐expressing CD1c, HLADR, and MICAB are highlighted with an orange arrow.
-
EQuantification of proportions of CD1c+ HLA‐DR+ cDC2 detected in SMSG from n = 4 pSS patients that either co‐express or not MICa/b.
-
FProportions of the CD56hi CD16+ NK cell subset proportions (left) after 16 h culture of sorted autologous CD56+ NK cell in media alone or in the presence of sorted autologous circulating Mo, cDC2, and cDC1 from n = 8 pSS patients at ratio 1:2 (myeloid cell:NK) and expression of CD107a (right) on CD56+ NK cells in these functional assays is shown.
Data information: (A, C, E, F): Data are represented as box and whiskers plots with maximum and minimum range and a median value central band. In panel (E), MICa/b+ and MICa/b− cells from the same donor are paired. Statistical significance was calculated with a two‐tailed Mann Whitney (A, C) or a Wilcoxon matched pairs (E, F) tests. *P < 0.05; **P < 0.01; ***P < 0.001; ****P < 0.0001.
Source data are available online for this figure.
