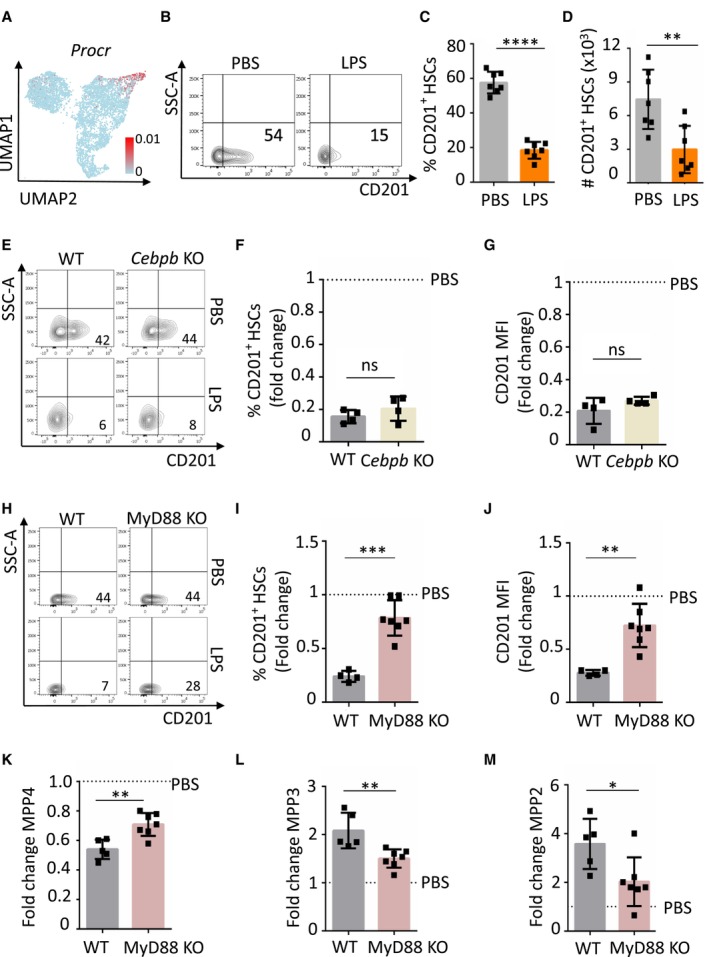
Figure 2. CD201 downregulation during emergency granulopoiesis is partially dependent on TLR4‐MyD88 signaling.

-
AUMAP plot color‐coded for the expression of Procr.
-
BRepresentative flow cytometry plots of BM cells isolated from mice treated with PBS control or LPS for 4 h. The x‐axes indicate CD201 expression. Numbers show percentage of CD201+ HSCs.
-
CQuantification of panel b. The y‐axis indicates percentage of CD201+ HSCs in BM.
-
DAbsolute number of CD201+ HSCs in BM isolated from mice treated with PBS control or LPS for 4 h. The x‐axis indicates absolute number.
-
ERepresentative flow cytometry plots indicating CD201 expression in HSCs isolated from WT and Cebpb KO mice treated with PBS or LPS as indicated for 4 h. Numbers indicate percentage of CD201+ HSCs.
-
F, GQuantification of panel (E). Percentage of CD201+ HSCs (F) and CD201 mean fluorescence intensity (MFI) (G). X‐axes indicate fold change relative to PBS control mice (dashed lines).
-
HRepresentative flow cytometry plots indicating CD201 expression in HSCs isolated from WT and MyD88 KO mice treated with PBS or LPS as indicated for 4 h. Numbers indicate percentage of CD201+ HSCs.
-
I, JQuantification of panel (H). Percentage of CD201+ HSC (I) and CD201 MFI (J) in WT (gray columns) and MyD88 KO (pink column) mice treated with LPS for 4 h.
-
K–MQuantification of MPP4 (K), MPP3 (L) and MPP2 (M) populations in WT (gray columns) and MyD88 KO (pink column) mice treated with LPS for 4 h. X‐axes indicate the fold change to PBS control.
Data information: Dashed lines indicate PBS levels. In this figure, data represent mean ± SD from at least two independent experiments. At least four animals were included in each group. Two‐tailed Student's t‐test was used to assess statistical significance (*P < 0.05, **P < 0.01, ***P < 0.001, and ****P < 0.0001, ns, not significant).
Source data are available online for this figure.
