
Figure 5. Role of CD201 in the lineage switch and contribution of CD201+ and CD201− HSCs to emergency granulopoiesis.
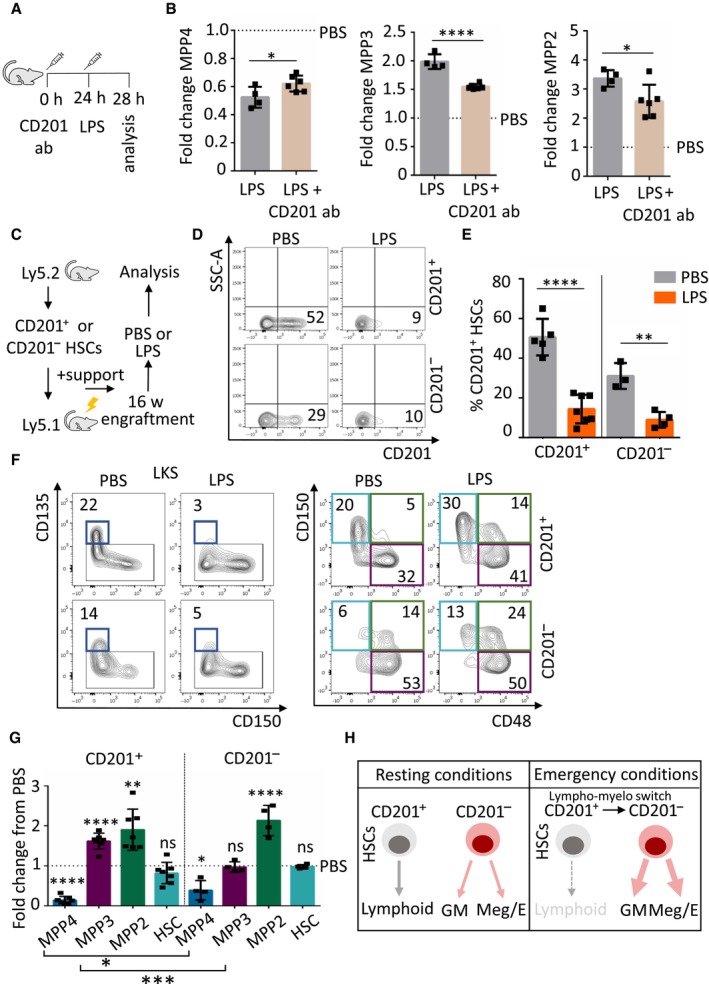
- Schematic representation of the experimental design. Mice were treated at the indicated time points with CD201 function‐blocking antibodies (CD201 ab) and LPS (35 μg).
- Quantification of MPP4, MPP3, and MPP2 populations in mice treated with LPS control (gray columns) or CD201‐function blocking antibodies followed by LPS administration (brown columns). X‐axes indicate the fold change to PBS control. Dashed lines indicate PBS levels.
- Graphical representation of the experimental design. CD201+ and CD201− chimeras were challenged with LPS or PBS control 16 weeks after transplantation. Mice were sacrificed and analyzed 4 h after the challenge.
- Flow cytometric analysis of BM from recipient mice that received CD201+ (top) or CD201− (bottom) HSCs and were challenged with PBS (left) or LPS (right). X‐axes indicate CD201 expression in donor‐derived (Ly5.2+) HSCs. Numbers indicate percentages.
- Quantification of panel (D). Y‐axis indicates percentage of donor‐derived Ly5.2+ CD201+ HSCs in chimeras that received CD201+ or CD201− HSCs. Analysis was done 4 h after treatment. At least three animals were included in each group.
- Flow cytometric analysis of BM from recipient mice that received CD201+ (top) or CD201− (bottom) HSCs and were challenge with PBS (left) or LPS (right). Flow cytometry plots indicate gating strategy to identify progenitor and stem cell populations. Dark blue boxes indicate multipotent progenitor 4 (MPP4), violet boxes indicate MPP3, green boxes indicate MPP2, and light blue boxes indicate HSCs. Numbers indicate percentages of LKS. Analysis was done 4 h after treatment.
- Quantification of panel (F). Y‐axis indicates fold change from PBS‐treated mice to LPS‐treated mice. Dashed line indicates PBS levels. At least six animals were included in each group.
- Graphical summary. Left panel indicates HSC behavior in resting conditions and right panel indicates HSC behavior during emergency granulopoiesis. HSCs could be divided according to CD201 expression. In steady‐state, CD201+ HSCs contribute to lymphoid production, while CD201− HSCs mainly supply granulocytic/monocytic (GM) and megakaryocytic/erythroid (Meg/E) demands. Under emergency granulopoiesis, CD201+ HSCs are transcriptionally rewired and CD201 expression is diminished, contributing to the enhanced GM and Meg/E production at the expenses of the lymphoid lineage supply.
Data information: Data represent mean ± SD from two independent experiments. Two‐tailed Student's t‐test was used to assess statistical significance (*P < 0.05, **P < 0.01, ***P < 0.001, ****P < 0.0001, not significant).
Source data are available online for this figure.