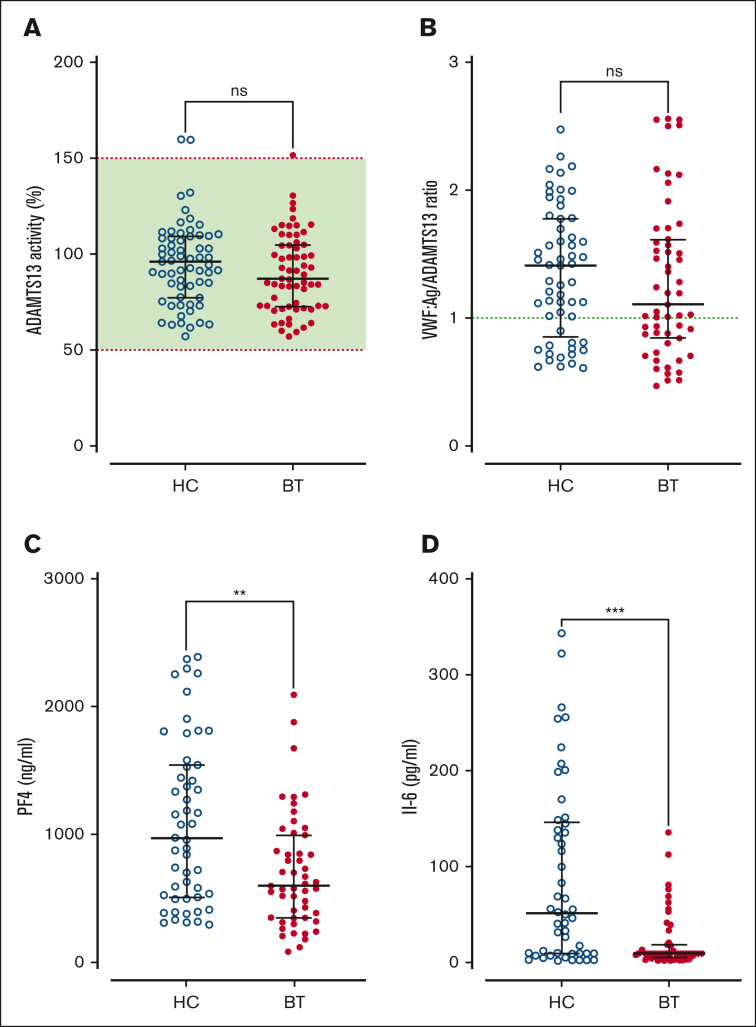
Figure 3.
ADAMTS13 activity in SCD children treated with hydroxycarbamide compared to blood transfusion. (A)ADAMTS13 activity and (B) VWF:Ag/ADAMTS13 ratio are compared between the HC and BT cohorts. Dotted green line represents the local normal VWF:Ag/ADAMTS13 ratio (1.0). Plasma levels of PF4 (C) and IL-6 (D) are compared between the HC and BT cohorts. Comparisons between groups were assessed by the Mann-Whitney U test; ns, not significant; ∗∗P < .01 and ∗∗∗P < .001.

