
Fig. 3.
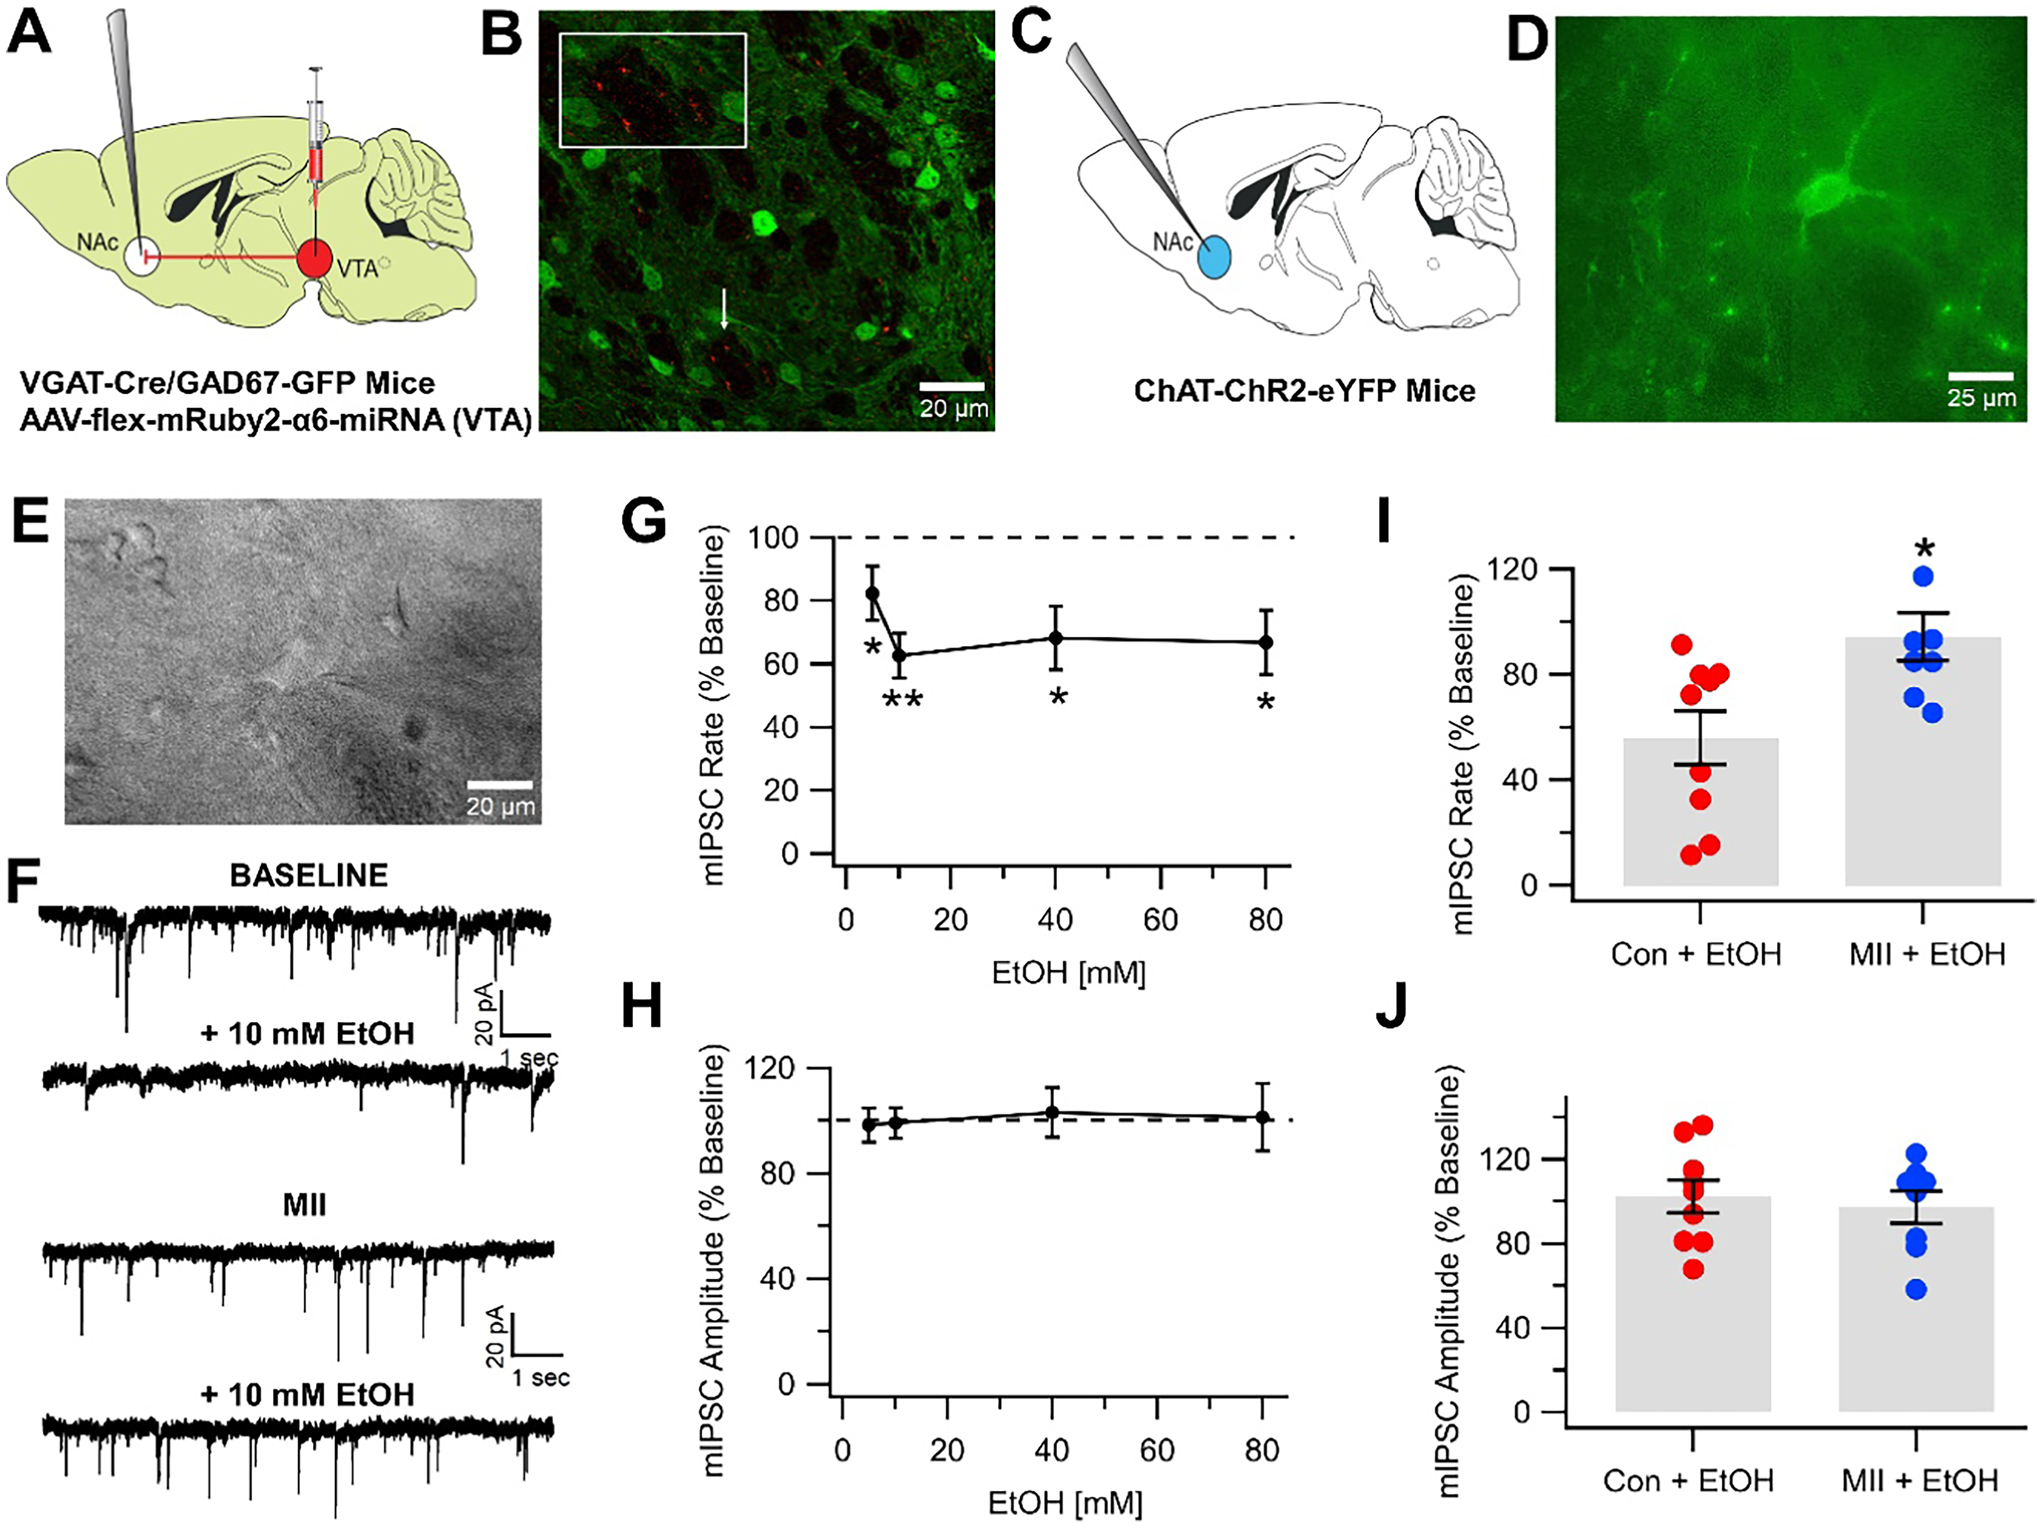
EtOH inhibits miniature IPSCs with block by α-conotoxins. A Illustration showing the experimental framework wherein AAV-flex-mRuby2-α6-miRNA was injected into the VTA 3 weeks prior and NAc CINs were recorded in whole-cell, voltage-clamp mode in VGAT-Cre/GAD67-GFP mice. B Immunohistochemical image showing that putative CINs in VGAT-Cre/GAD67-GFP mice are innervated by VTA-NAc GABAergic projections expressing α6*-nAChRs. Imaged using oil immersion 60 × objective (Olympus, PlanApo 1.40 numerical aperture). C Illustration showing the experimental framework wherein CINs were recorded in ChAT-ChR2-eYFP mice. D Image showing CINs in ChAT-ChR2-eYFP mice with fluorescence imaging (Olympus, UPlanFLN 1.30 numerical aperture). E Patch clamp recording of CINs in ChAT-ChR2-eYFP mice using infrared imaging. F Representative 10-s recordings of CIN mIPSCs. G Ethanol (5–80 mM) reduced CIN mIPSC frequency. H Ethanol (5–80 mM) did not affect CIN mIPSC amplitude. I, J Summary of effects of MII on EtOH inhibition of CIN mIPSCs. MII significantly reduced EtOH inhibition of CIN mIPSC frequency (I), but not amplitude (J). Asterisks * and ** indicate significance levels p < 0.05 and p < 0.01