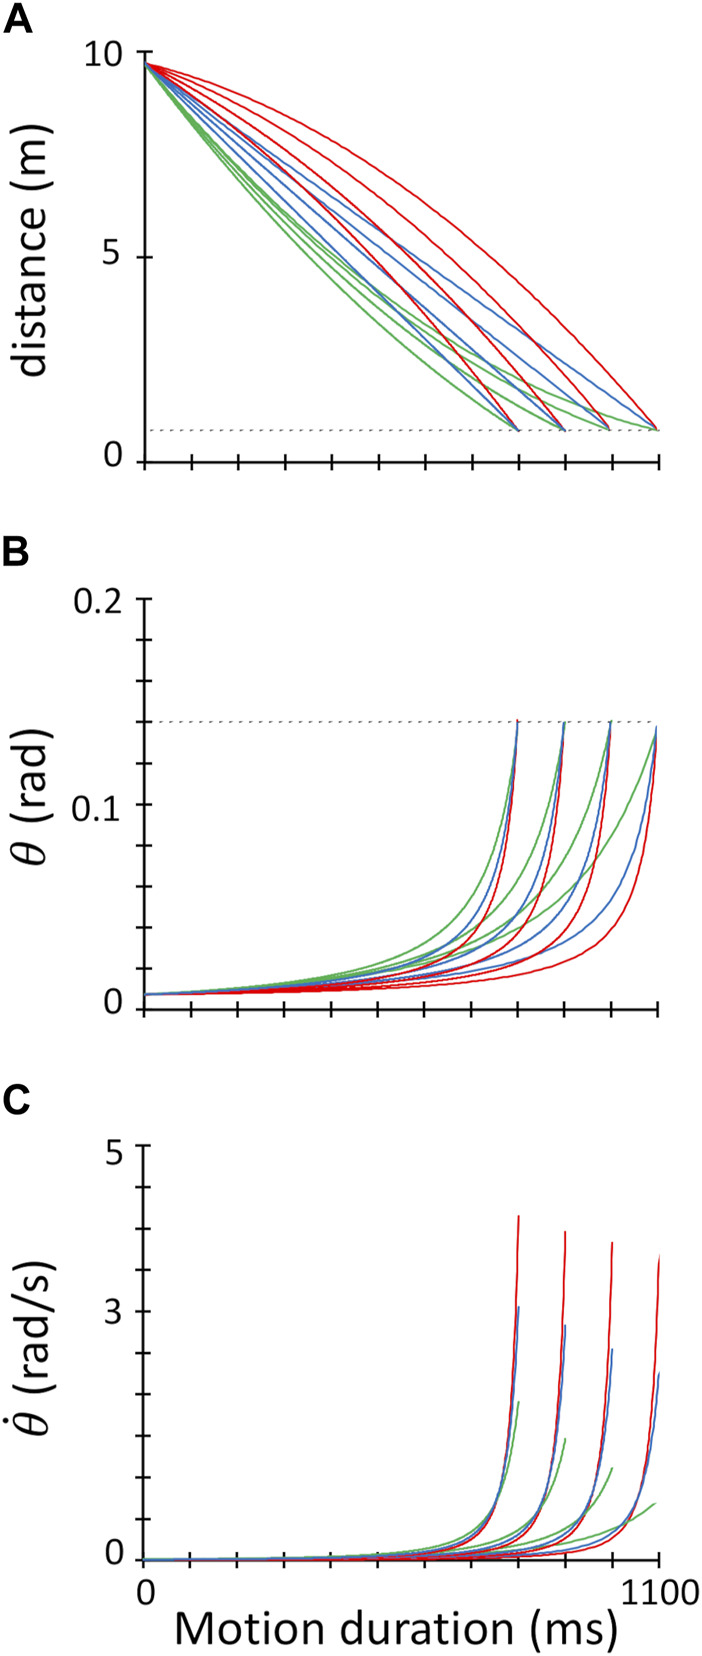
FIGURE 2.

Target kinematics. (A). The distance of the target from the interception point (in meters, considering a real size virtual scene) is plotted against the time from the target motion onset. Motion trajectories intersect the interception height (dashed grey line) at the four target motion durations (1,100 ms; 1,000 ms; 900 ms; 800 ms). Red, blue, and green traces refer to 1 g, 0 g and -1g trials, respectively. (B). Time course of the retinal image size ( ) for the 12 experimental conditions. Same color coding as in (A). (C). Time course of the retinal image dilation rate ( ) for the 12 target trajectories. Same color coding as in A-B.
