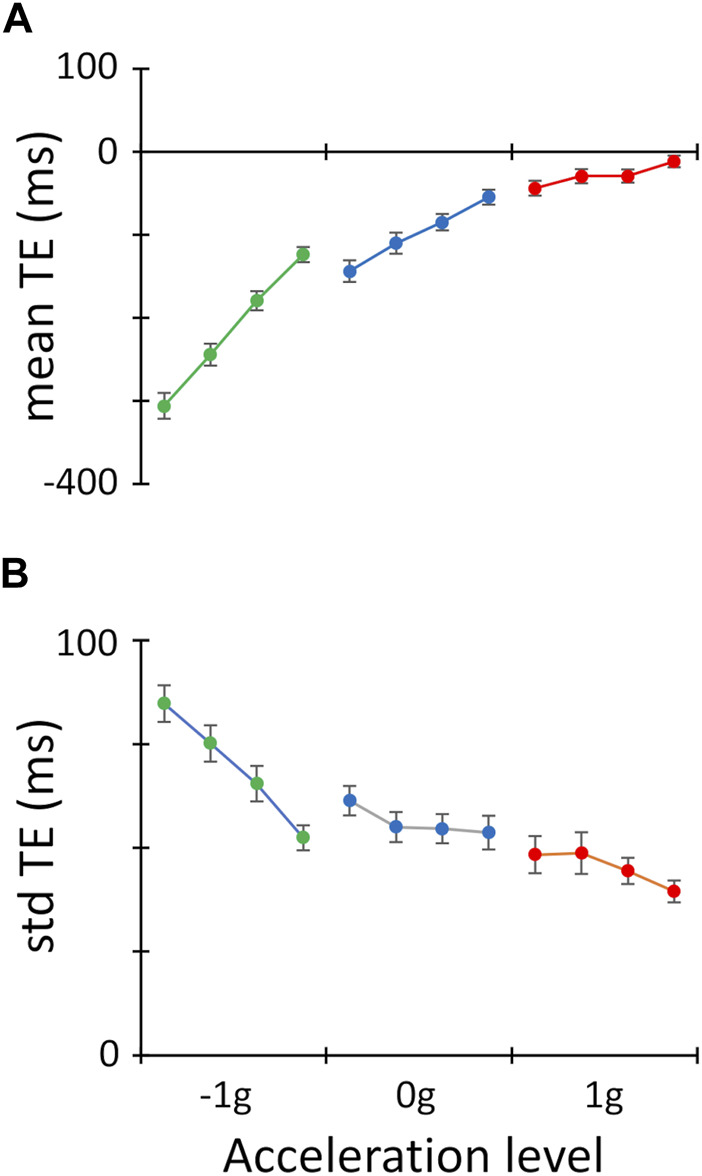
FIGURE 3.

Interception accuracy and precision. (A). Mean TE values ±SEM (interception accuracy) computed across participants for each experimental conditions are plotted with respect to the twelve experimental conditions. Data points are grouped for target acceleration (red: 1 g; blue: 0 g; green: 1g) and, within each target acceleration level, they are ordered for target duration (from left to right 1,100 → 800 ms). (B). Same layout as A for std TE values ±SEM (interception precision).
