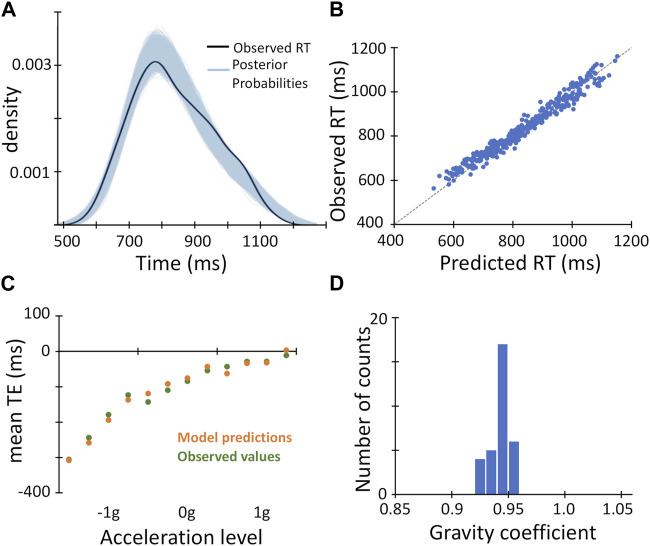
FIGURE 5.
Results of Bayesian linear mixed regression model including gravity and optical predictors. (A). The observed distribution of mean Response Time (RT) values across experimental conditions and participants (black curve) is overlaid on the family of 4,000 posterior probabilities resulting from the Bayesian linear mixed regression model (sky-blue curves). (B). The observed mean Response Time (RT) values across experimental conditions and participants are plotted against the values predicted by the Bayesian linear mixed regression model. As in Figure 4D, the light grey dashed line represents the unitary slope line. (C). The observed mean TE values (dark green symbols, same datapoints as in Figure 3A) and the mean TE values predicted by the Bayesian linear mixed regression model are plotted against the experimental conditions, grouped for target acceleration, and ordered for target motion duration (from left to right 1,100 → 800 ms). (D). Distribution of the gravity predictor regression coefficient estimated by the Bayesian regression model across participants.

