
Figure 3.
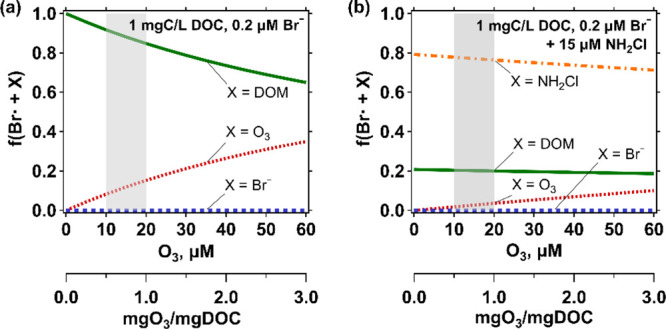
Calculated fractions (see text) of Br• reacting with DOM (green line), ozone (red line), bromide (blue line), or NH2Cl (orange line) as a function of ozone concentration in the (a) absence or (b) presence of NH2Cl. The selected concentrations were 1 mgC/L DOC, 0.2 μM Br– (16 μg/L Br–), and 15 μM NH2Cl. Shaded areas indicate a typical range of ozone doses applied in drinking water treatment in Switzerland (0.5–1.0 mgO3/mgC).