
Figure 1.
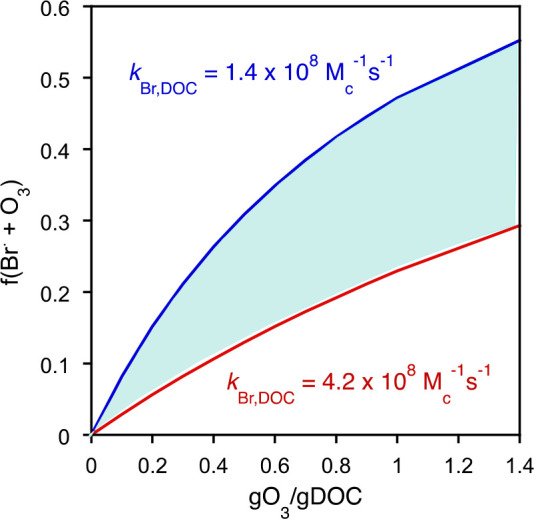
Fraction of the reaction of ozone with the bromine radical as a function of the specific ozone dose (the initial ozone dose is taken for the calculations). The blue and red curves represent the lower and higher limits, respectively, of the second-order rate constant for the reaction of Br• with DOM. The colored area represents the range of the fraction f(Br• + O3) (eq 20) for the lower or higher second-order rate constants for the Br•–DOM reaction (second-order rate constants were obtained from ref (66)) (DOC = 5 mg/L).