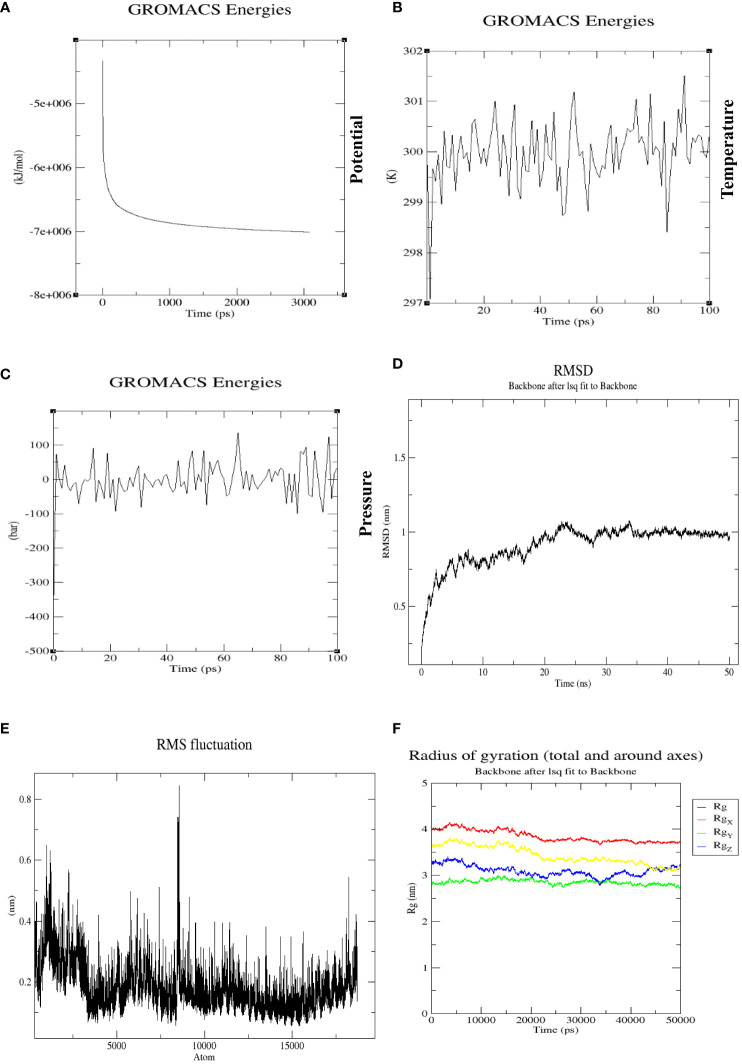
Figure 10.
(A) The potential energy plot during the simulation at 3,000 ps was found to be −7e+006, which shows that our system has the minimum energy to start real dynamics. (B) Average temperature progression plot of the vaccine-TLR3 complex, which remained at 299.77K over 100 ps. (C) Average pressure plot fluctuations, which remained at 1 bar during a 100-ps equilibration. (D) RMSD plot of vaccine-TLR3 complex over a 50-ns MD production run. There was a noticeable rise in the RMSD for this system until 35 ns (beginning at 0.5 nm and reaching a peak at an RMSD of 1 nm), with slight fluctuations. After that, the system eventually reached a stable state and maintained an RMSD of 0.9 nm, which represents the stability of complex. (E) The RMSF of a complex during MD production simulation. The residues in the designed vaccine-TLR3 complex were evaluated for flexibility using RMSF. The highest fluctuating residues were observed in atoms between 5,500 and 9,000. (F) Rg of the complex around all axes with minimum fluctuations, indicating the compactness of the vaccine-TLR3 complex during the whole MD simulation run of 50 ns.

