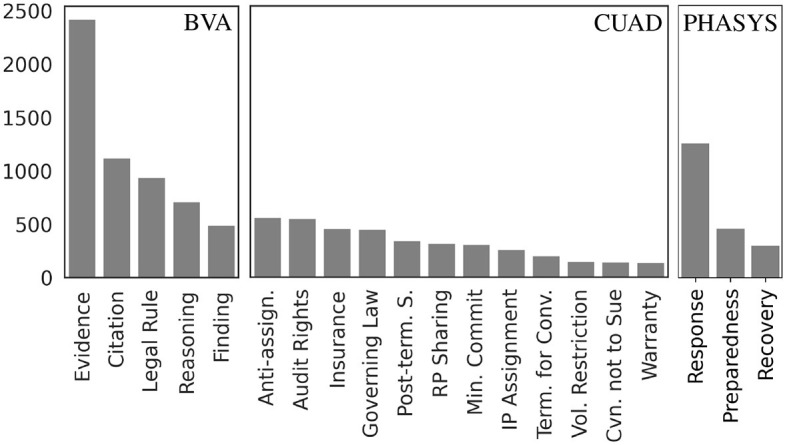
Figure 1.

Semantic types distribution. The figure shows the distribution in terms of number of examples of the semantic types across the three data sets. In the BVA data set (left), although Evidence is the dominant category, the four remaining types are reasonably represented. The CUAD data set (center) does not have a clearly dominant type. Several types are represented by a relatively small number of examples (~100). The PHASYS data set (right) is heavily skewed toward the Response label (62.4%).
