Fig. 6.
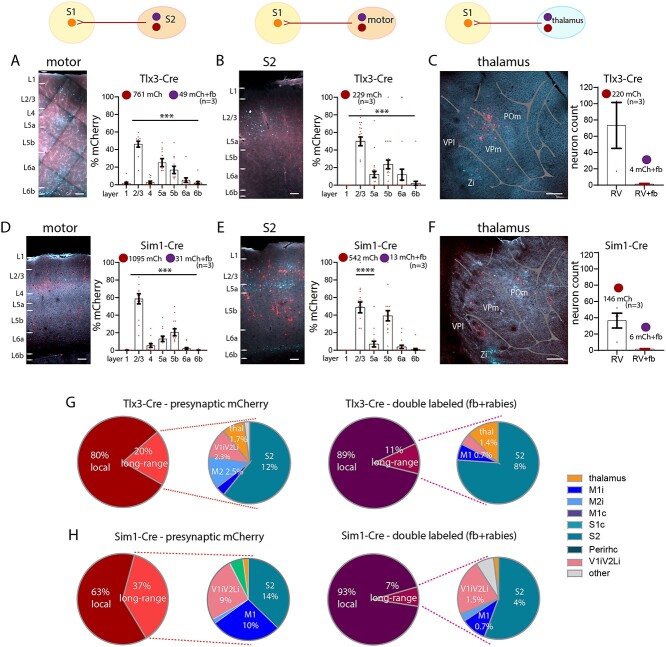
Long-range synaptic input to S1 L1 in Tlx3 and Sim1 neurons in combination with fb. A to C) Images and quantification of presynaptic neurons (rabies and fb double labeled) for Tlx3 brains in A) S2 cortex ipsilateral, in B) motor cortices, and in C) thalamus. D to F) Images and quantification of presynaptic neurons (rabies and fb double labeled) for Sim1 brains, in D) S2 cortex ipsilateral, in E) motor cortices ipsilateral, in F) thalamus. G) Pie charts showing presynaptic input to S1 for both IT neurons (left) and L1 projecting neurons that are presynaptic to L5 neurons (right). H) Pie charts showing presynaptic input to S1 for both PT neurons (left) and L1 projecting neurons that are presynaptic to L5 neurons (right). Most input to IT and PT neurons was local. The long-range input to S1 L1 was from S2, visual (V1 and V2L), M1, and thalamus. For IT neurons, the bulk of the neurons presynaptic to these cells that also projected to L1 were local neurons (89%). Presynaptic input to PT neurons in S1 was divided into 63% local and 37% long-range. The long-range input was from S2, visual (V1 and V2L), and M1. Presynaptic input to PT neurons that also targeted L1 arose from local neurons (93% of the total input). Total number of neurons counted in each mouse line, data from 3 brains each genotype, shown as mean ± SEM. Each dot in the graphs (in A to F) represents one brain section. Abbreviations in a: I, ipsilateral; c, contralateral. Statistical analysis with 1-way ANOVA, Bonferroni post hoc test, ****P > 0.0001. Analysis details in Supplementary Table 3a, b, and d. Scale bar in A, B, D, E, 100 μm, in C, F, 500 μm.

