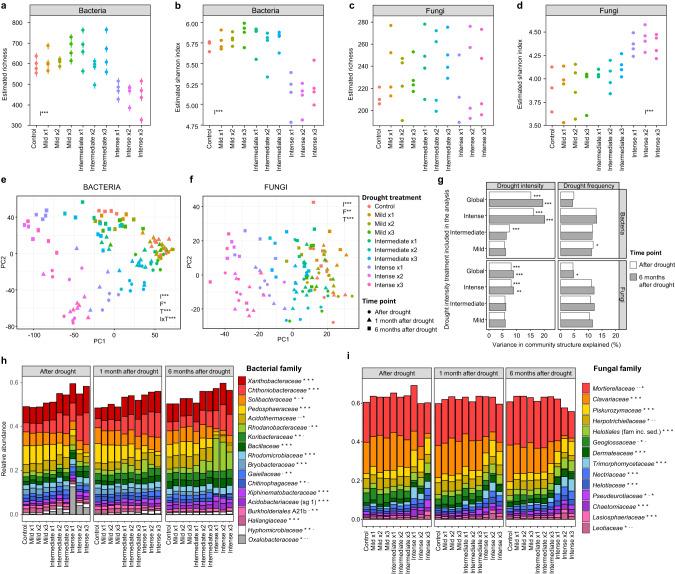
Fig. 1. Effects of drought on soil microbial community structure.
a–d Alpha diversity 6 months after drought (mean ± error of estimated values). e, f Community structure. The first two axes explained 17.3% (bacteria) and 5.4% (fungi) of the variance. g Percentage variance explained in PERMANOVA analyses including all the treatments (global) or just one drought intensity level and the control. h, i Relative abundance of microbial families. Data = mean (n = 4). sg subgroup. Significance of drought intensity (I), frequency (F), and time point (T) is shown (a–g): *p < 0.05, **p < 0.01, ***p < 0.001, or significance of drought treatment for each sampling time (h, i): -p > 0.05, *p < 0.05.

