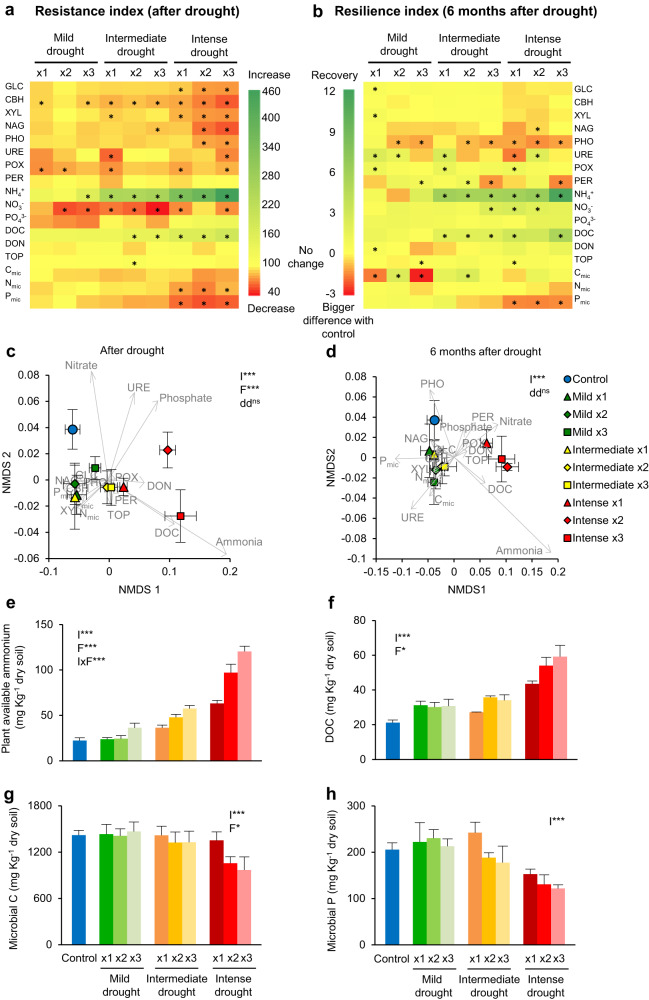
Fig. 2. Effects of drought on soil function.
a, b Resistance and resilience indexes. Asterisks indicate significant change (value ≠ 0, p < 0.05). c, d Functional structure of soils. Mean ± SE (n = 4). Significance of PERMANOVA analysis evaluating the effects of drought intensity (I) and frequency (F) is shown: *p < 0.05, **p < 0.01, ***p < 0.001. Differences in data dispersion (dd) among groups is also shown (ns non-significant). GLC: β-glucosidase, CBH: cellobiohydrolase, XYL: xylosidase, NAG: N-acetylglocasiminidase, PHO: acid phosphatase, POX: phenoloxidase, PER: peroxidase, URE: urease, DOC: dissolved organic carbon, DON: dissolved organic nitrogen, TOP: total organic phosphorus, Cmic: microbial carbon, Nmic : microbial nitrogen, Pmic : microbial phosphorus. e–h Effects of drought on selected soil nutrients after drought, summarised by drought intensity and frequency (x1: 1 event, x2: 2 events, x3: 3 events) treatments. Significance of linear mixed models evaluating the effects of drought intensity (I) and frequency (F), with soil as random factor, is shown in each graph. Values = mean ± standard error, n = 4.

