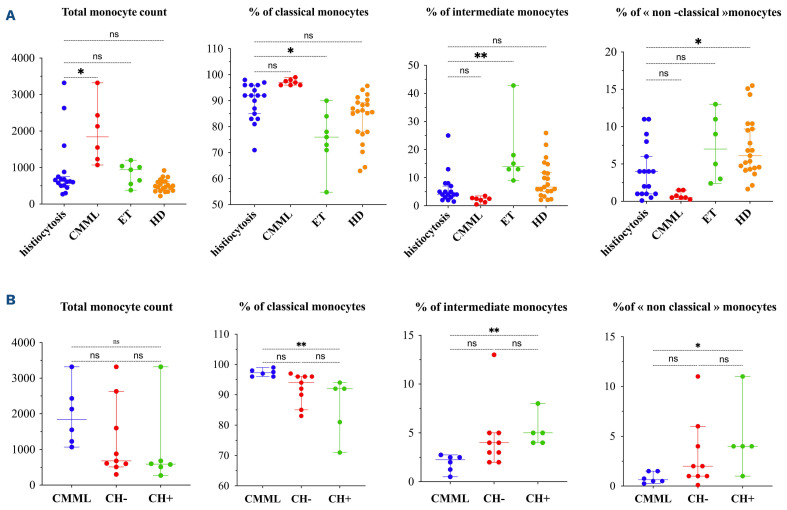
Figure 2.
Distribution of monocyte subsets in histiocytoses and myeloid neoplasms and according to molecular status. (A) Distribution of monocyte subsets in patients with histiocytoses (N=17), chronic myelomonocytic leukemia (CMML) (N=7), essential thrombocythemia (ET) (N=7) and heathy donors (HD) (N=21). (B) Distribution of monocyte subsets in histiocytoses with clonal hematopoiesis (CH+) (N=6), without clonal hematopoiesis (CH-) (N=9) and CMML patients (N=7). Percentages are given among total monocytes. Horizontal bars show the median and error bars the interquartile range. P value is the result of the ANOVA test. *P<0.05; **P<0.01; ns: non-significant.

