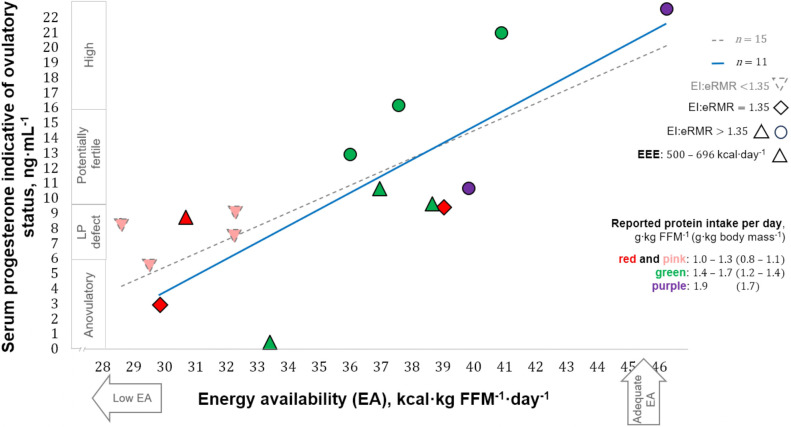
Figure 2.
Correlation between energy availability and progesterone concentration. LP, luteal phase; FFM, fat-free mass; EI, reported energy intake; eRMR, estimated resting metabolic rate; EEE, reported exercise “training and physical activity” energy expenditure. Shapes of data points indicate EI:eRMR with triangles also showing the highest reported EEE. Colours in data points indicate reported protein intake.

