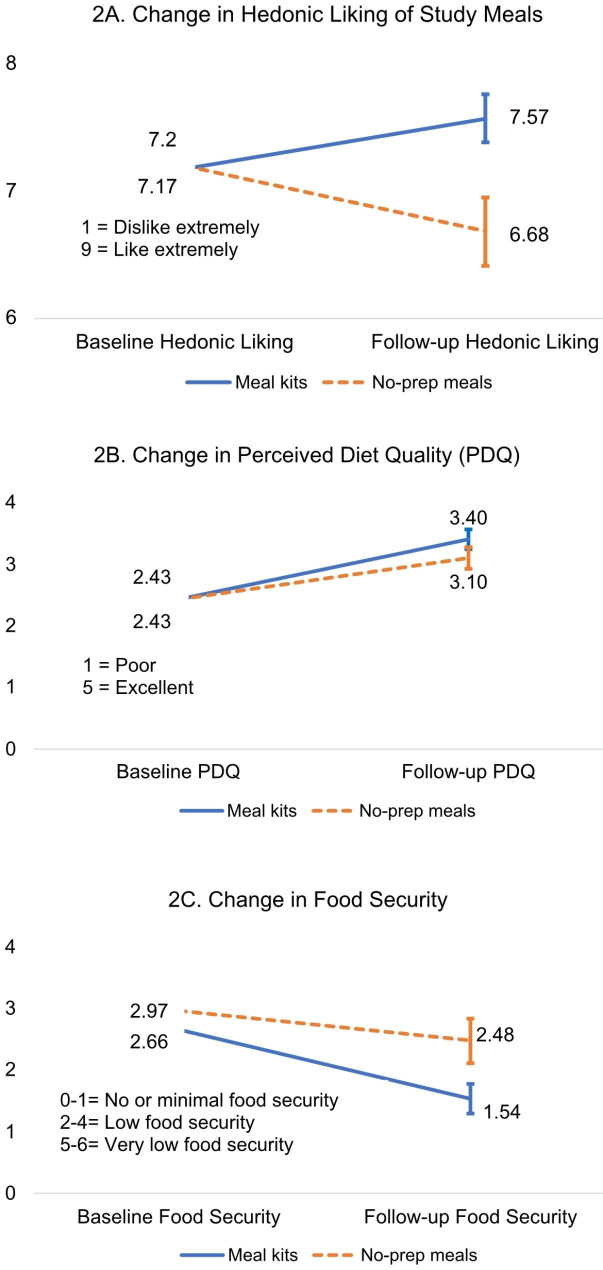
Fig. 2.
For all figures the solid blue line represents the group that received meal kits and the dotted orange line represents the group that received no-prep meals. Error bars indicate the standard error of the group mean. (A) displays the change in hedonic liking of study meals from baseline to follow-up by group. There was a significant interaction on hedonic liking of study foods. Participants that received meal kits had greater improvements in hedonic liking of study meals over time (M = 7.57, SE = 0.19, Min = 4, Max = 9) than participants in the no-prep group (M = 6.68, SE = 0.27, Min = 2.32, Max = 9). (B) illustrates participants change in perceived diet quality from baseline to follow-up by group. Both groups reported their diet was higher quality at follow-up than at baseline. Participants that received meal kits had slightly higher perceived diet quality at follow-up (M = 3.40, SE = 0.16, Min = 2, Max = 5), than participants that received no-prep meals (M = 3.10, SE = 0.18, Min = 1, Max = 5), however, this was not a statistically significant difference between groups and no interaction was observed. (C) displays participants change in food security from baseline to follow-up by group. Both groups reported higher food security (lower food insecurity) at follow-up than at baseline. Participants that received meal kits had slightly higher food security (lower food insecurity) at follow-up (M = 1.54, SE = 0.24, Min = 0, Max = 6), than participants that received no-prep meals (M = 2.48, SE = 0.36, Min = 1, Max = 5), however, this was not a statistically significant difference between groups and no interaction was observed

