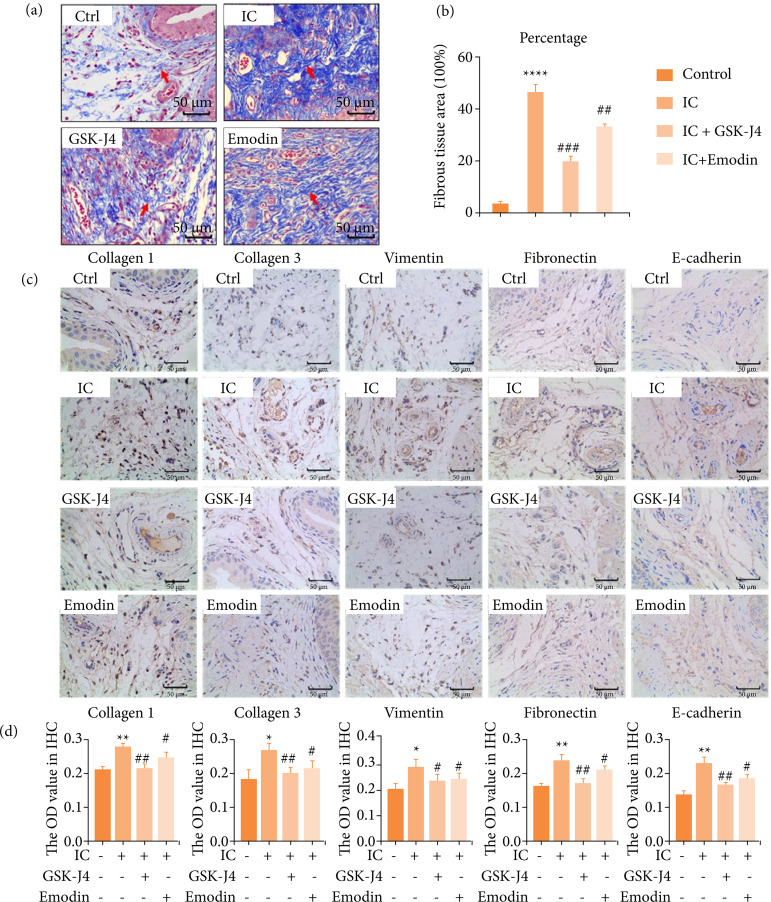
Figure 4. The degree and distribution of urinary bladder (UB) fibrosis in mice with cystitis after emodin treatment. (a) The extent of fibrosis in bladder interstitium was assessed with Masson staining. Scale bar = 50 μm final magnification. Red arrow: fibrous tissue (indigo dye part). (b) Quantitative analysis of the degree of tissue fibrosis in (a) (fibrotic tissue percentage). (c) Expression levels of fibrosis positive proteins assessed by immunohistochemistry. Scale bar = 50 μm final magnification. (d) Quantitative analysis of relative protein expression in (c) (high OD value represents high-protein expression). Mice that received CYP showed increased protein expression as compared to control mice, while mice that received CYP + emodin/or GSK-J4 showed reduced the expression. Data are represented as the mean ± standard deviation.
Source: Elaborated by the authors. Ctrl: control; IC: interstitial cystitis; OD: optical density; CYP: cyclophosphamide; compared with control, * P < 0.05, ** P < 0.01, **** P < 0.0001; compared with IC group, # P < 0.05, ## P < 0.01, ### P < 0.001 represent significant differences between the indicated columns.

