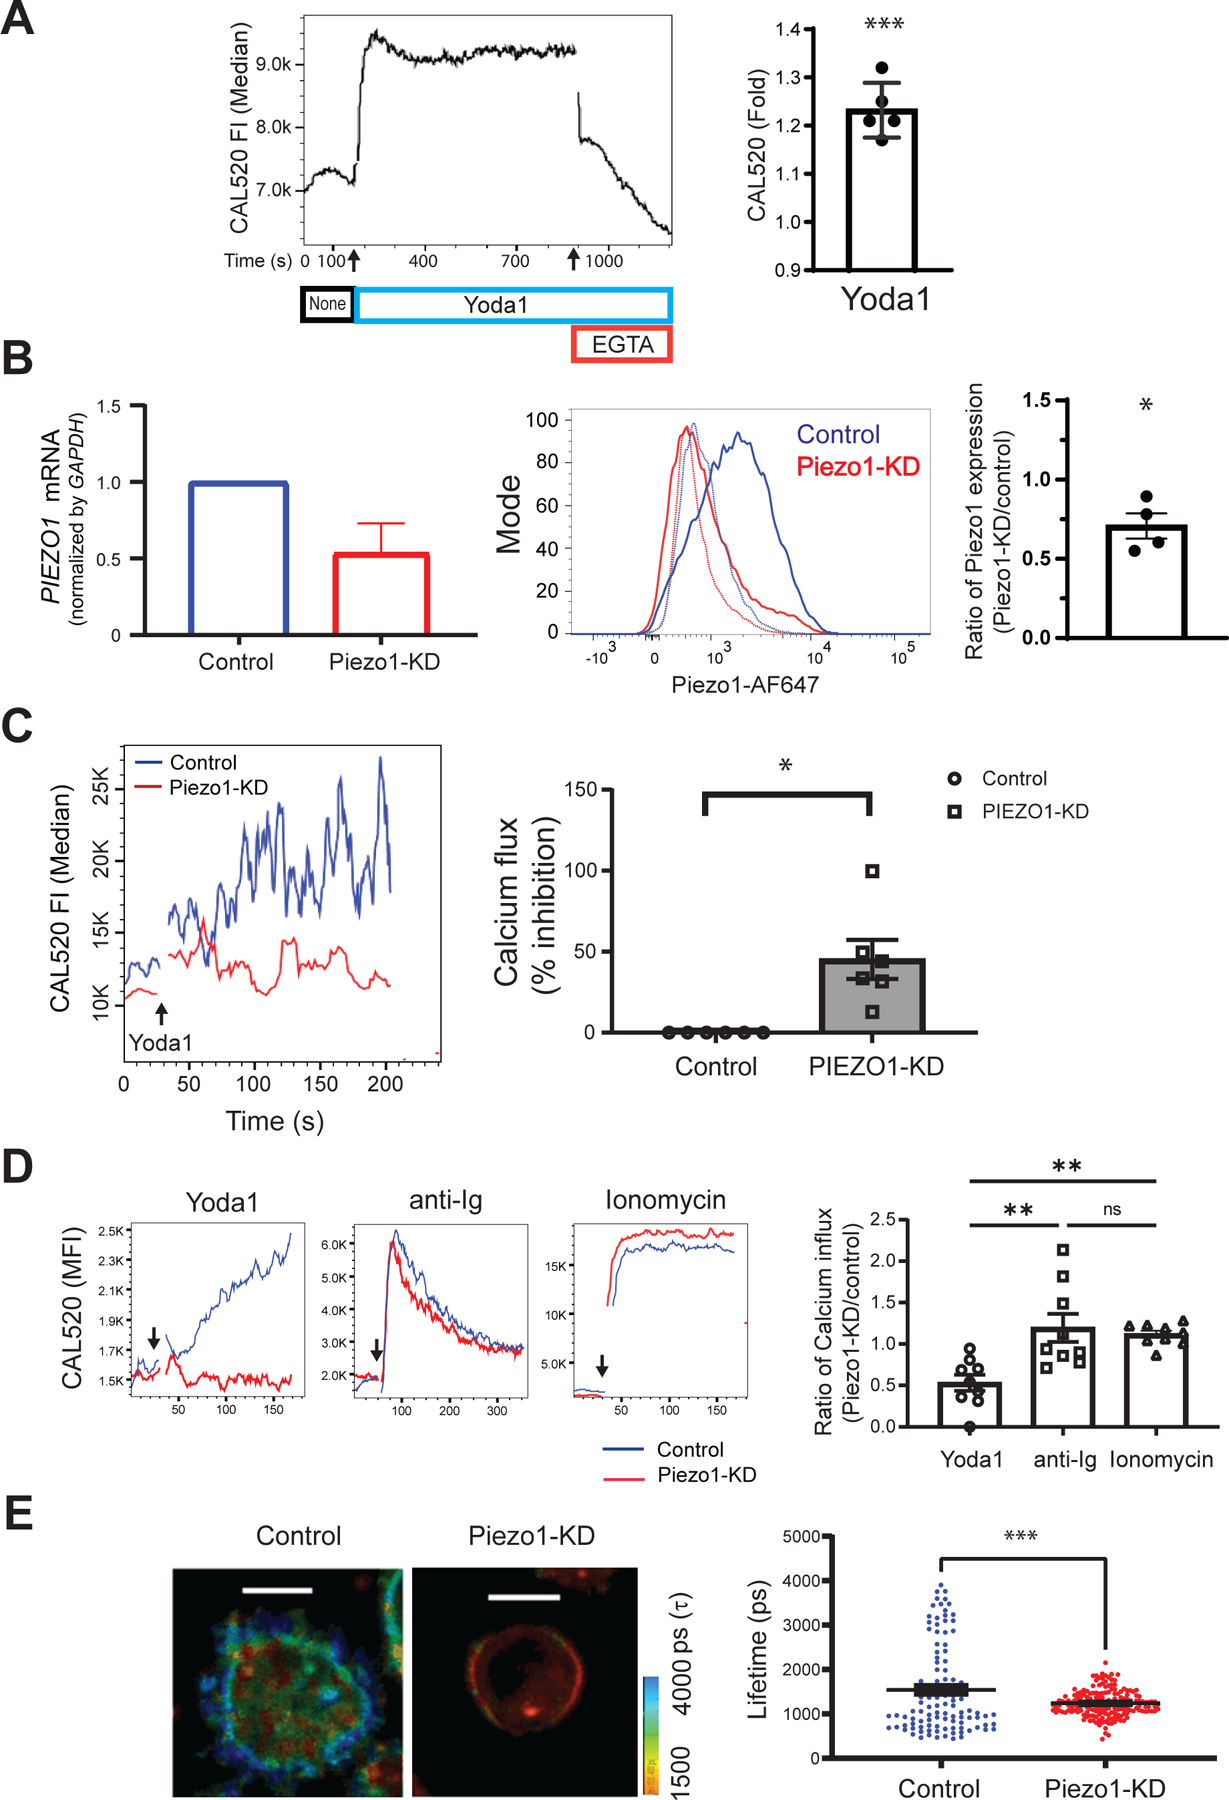
Fig. 3. siRNA-mediated knockdown of Piezo1 inhibits B cell responses.

(A) Purified human tonsillar B cells were labeled with CAL520 and a monoclonal antibody specific for the GC B cell marker, CD10, to gate naïve and memory B cells. After 180 s of baseline recording (None, black), 15 μM Yoda1 (blue) was added to the B cells in solution, which was followed by the addition of 2 mM EGTA (red). Ca2+ signals were analyzed for 1200 s by flow cytometry. Left: Representative plot of the median CAL520 fluorescence intensity (FI) values over time. Right: Quantification of the Ca2+ influxes calculated for B cells from five donors as the fold-change in the median CAL520 FI induced by Yoda-1 relative to the baseline FI. Data are means ± SEM from five independent experiments. (B) B cells purified from human PBMCs with magnetic beads were transfected with either control siRNA (Control) or Piezo1-specific siRNA (Piezo1-KD) with a 4D Amaxa nucleofector. Left: PIEZO1 mRNA abundance was quantified by real-time qRT-PCR analysis and normalized to that of GAPDH mRNA. Middle: Representative histogram of total Piezo1 abundance by flow cytometry after immunofluorescence staining with an Alexa Fluor 647–labeled Piezo-specific antibody. Right: Quantification of Piezo1 abundance for B cells from four donors shown as the ratio of the Piezo1 abundance in Piezo1-KD cells relative to that in Control cells. Data are means ± SEM from four independent experiments. (C) Control and Piezo1-KD B cells were labeled with CAL520 and Ca2+ flux was measured over time by flow cytometry before and after the addition of 15 μM Yoda-1. Left: Representative Ca2+ curves after Yoda-1 treatment of the indicate cells. Right: Quantification of the percentage inhibition of the Ca2+ flux in Piezo1-KD cells as compared to that in Control cells obtained from six donors. Data are means ± SEM from six independent experiments. (D) Control and Piezo1-KD B cells were labeled with CAL520, and Ca2+ fluxes were measured over time by flow cytometry for cells treated with Yoda-1, anti-Ig, or ionomycin. Left: Representative Ca2+ kinetics plot with arrows marking the times, after baseline recording, when each stimulant was added. Right: Quantification of Ca2+ increases induced by Yoda1, soluble anti-Ig, or ionomycin were calculated as the ratio of the fold-changes in CAL520 MFI between Piezo1-KD and Control cells upon stimulation relative to the baseline MFI for B cells from nine donors. Data are means ± SEM from nine independent experiments. (E) Control and Piezo1-KD B cells were labeled with Flipper-TR and placed on glass and the lifetime decay of the dye was determined. Left: Two representative B cells showing lifetime decay. Right: Quantification of the lifetime decay of Flipper-TR for control (111 cells) and Piezo1-KD (177 cells) B cells. Scale bars, 5 μm. Data are means ± SEM from five independent experiments. *P ≤ 0.05, **P ≤ 0.01, and ***P ≤ 0.001; ns, not significant. Data in (A) to (C) were analyzed by one-sample t test with a hypothetical value of zero, data in (D) were analyzed by Kruskal-Wallis test, followed by Dunn’s multiple comparisons test; and data in (E) were analyzed by two-tailed, unpaired t test with Welch’s correction.
