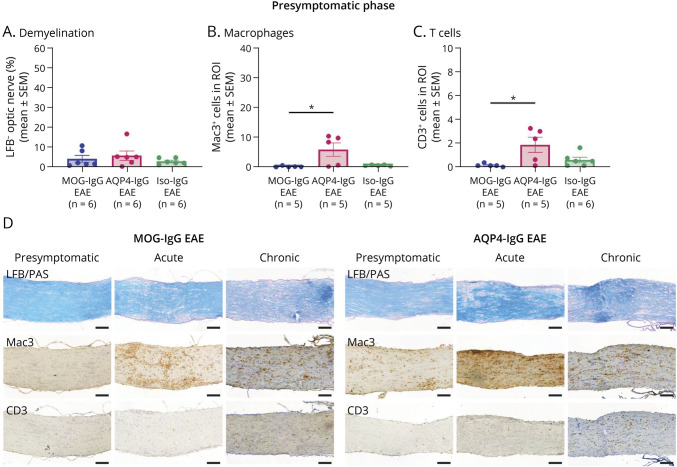
Figure 3. Quantification of Demyelination and Immune Cell Infiltration in the Optic Nerve.
Disease model comparison at presymptomatic disease phase: Quantification of (A) percentage of demyelination after LFB/PAS staining, (B) macrophage infiltration after IHC for Mac3+ cells, and (C) T-cell infiltration after IHC for CD3+ cells. Presymptomatic: 1 experiment, acute: 2 independent experiments. Kruskal-Wallis test. *p < 0.05, **p < 0.01. (D) Histologic representation of LFB/PAS, Mac3, and CD3 IHC staining used for quantification at presymptomatic, acute disease phase, and chronic disease phase. Scale bars = 100 μm. AQP = aquaporin; EAE = experimental autoimmune encephalomyelitis; IgG = immunoglobulin G; IHC = immunohistochemistry; Iso = isotype control; LFB = Luxol fast blue; MOG = myelin oligodendrocyte glycoprotein; PAS = periodic acid–Schiff; ROI = region of interest.

