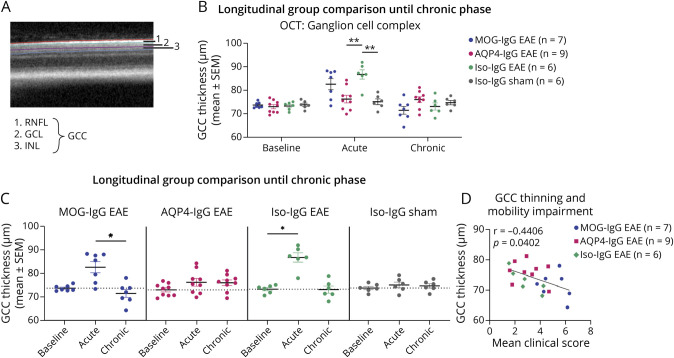
Figure 5. Thickness of Ganglion Cell Complex of EAE With Administration of MOG-IgG, AQP4-IgG, or Iso-IgG and Sham-Immunized Controls.
Ganglion cell complex thickness was evaluated through optical coherence tomography at bl, ac disease phase, and chr disease phase. (A) OCT retinal B-scan indicating GCC layer segmentation: GCC comprises RNFL, GCL, and IPL. (B, C) Experiment with follow-up until chronic disease phase in MOG-IgG EAE (n = 7 paired observations), AQP4-IgG EAE (n = 9 paired observations), Iso-IgG EAE (n = 6 paired observations), and sham-immunized controls (n = 6 paired observations). Two independent experiments. (B) Disease model comparison at bl, ac disease phase, and chr disease phase: Mann-Whitney test. (C) Within-group comparisons: Friedman test. *p < 0.05. (D) Correlation with mobility impairment. The mean clinical score reflects the average of all mobility impairment scores per animal from the day of disease onset until end of experiment. Spearman correlation coefficient r and p value indicated on graph. ac = acute; AQP4 = aquaporin 4; bl = baseline; chr = chronic; DPI = days postimmunization; EAE = experimental autoimmune encephalomyelitis; GCC = ganglion cell complex; GCL = ganglion cell layer; IPL = inner plexiform layer; Iso = isotype control; MOG = myelin oligodendrocyte glycoprotein; RNFL = retinal nerve fiber layer.

