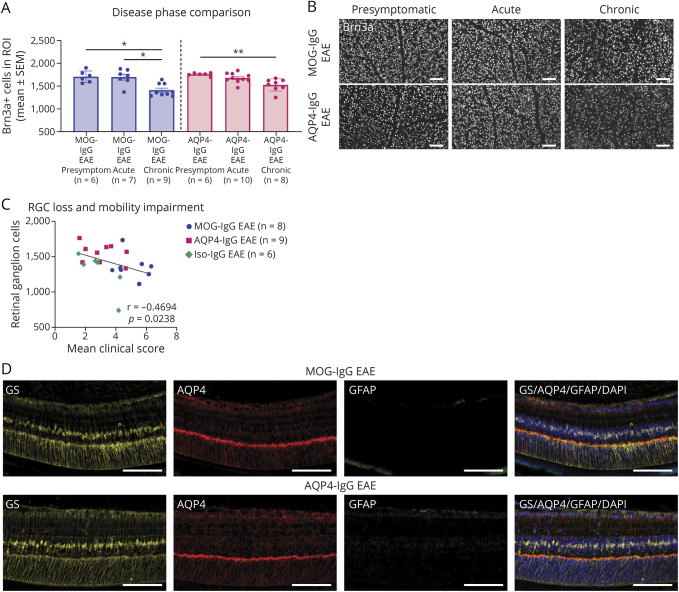
Figure 6. Investigation of Retinal Ganglion Cells and Müller Cell Activation to Assess Retinal Involvement.
(A) Disease phase comparison of MOG-IgG EAE and AQP4-IgG EAE animals for RGC counts. Three independent experiments. Kruskal-Wallis test. *p < 0.05, **p < 0.01. (B) Histologic representation of Brn3a staining used for quantification at presymptomatic, acute, and chronic disease phases. Scale bars = 100 μm. (C) Correlation with mobility impairment. The mean clinical score reflects the average of all mobility impairment scores per animal from the day of disease onset until the end of experiment. Two independent experiments. Spearman correlation coefficient r and p value indicated on graph. (D) Histologic representation of IF staining of the retina showing Müller cells (GS), AQP4 and astrocytes/Müller cell activation (both GFAP). Scale bars = 100 μm. AQP = aquaporin; CFA = complete Freund adjuvant; EAE = experimental autoimmune encephalomyelitis; GFAP = glial fibrillary acidic protein; GS = glutamate synthetase; IF = immunofluorescence; IgG = immunoglobulin G; IHC = immunohistochemistry; Iso = isotype control; MOG = myelin oligodendrocyte glycoprotein; RGC = retinal ganglion cell; ROI = region of interest.

