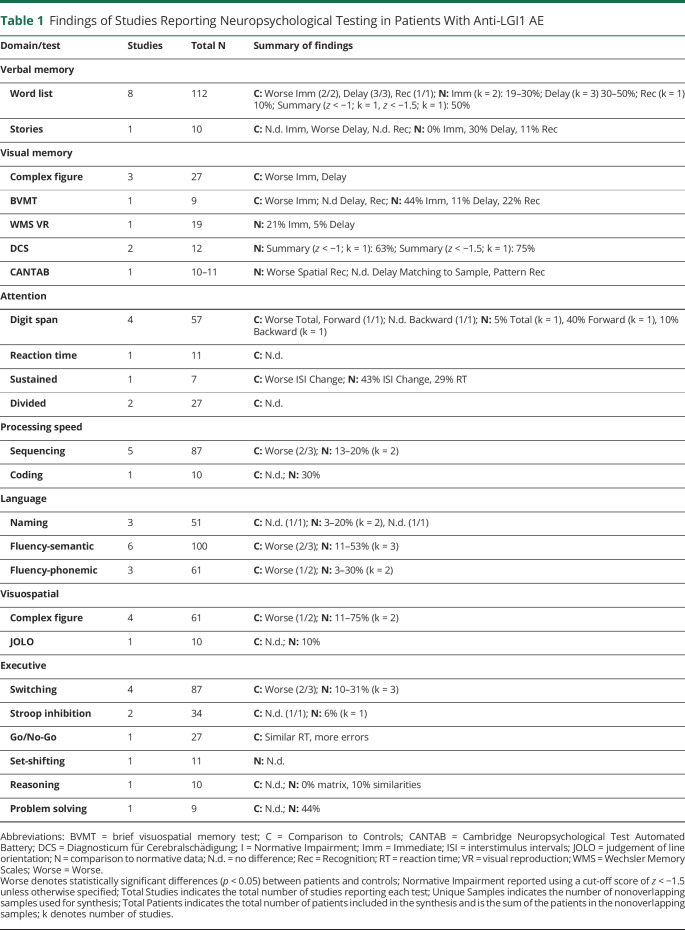
Table 1.
Findings of Studies Reporting Neuropsychological Testing in Patients With Anti-LGI1 AE
| Domain/test | Studies | Total N | Summary of findings |
| Verbal memory | |||
| Word list | 8 | 112 | C: Worse Imm (2/2), Delay (3/3), Rec (1/1); N: Imm (k = 2): 19–30%; Delay (k = 3) 30–50%; Rec (k = 1) 10%; Summary (z < −1; k = 1, z < −1.5; k = 1): 50% |
| Stories | 1 | 10 | C: N.d. Imm, Worse Delay, N.d. Rec; N: 0% Imm, 30% Delay, 11% Rec |
| Visual memory | |||
| Complex figure | 3 | 27 | C: Worse Imm, Delay |
| BVMT | 1 | 9 | C: Worse Imm; N.d Delay, Rec; N: 44% Imm, 11% Delay, 22% Rec |
| WMS VR | 1 | 19 | N: 21% Imm, 5% Delay |
| DCS | 2 | 12 | N: Summary (z < −1; k = 1): 63%; Summary (z < −1.5; k = 1): 75% |
| CANTAB | 1 | 10–11 | N: Worse Spatial Rec; N.d. Delay Matching to Sample, Pattern Rec |
| Attention | |||
| Digit span | 4 | 57 | C: Worse Total, Forward (1/1); N.d. Backward (1/1); N: 5% Total (k = 1), 40% Forward (k = 1), 10% Backward (k = 1) |
| Reaction time | 1 | 11 | C: N.d. |
| Sustained | 1 | 7 | C: Worse ISI Change; N: 43% ISI Change, 29% RT |
| Divided | 2 | 27 | C: N.d. |
| Processing speed | |||
| Sequencing | 5 | 87 | C: Worse (2/3); N: 13–20% (k = 2) |
| Coding | 1 | 10 | C: N.d.; N: 30% |
| Language | |||
| Naming | 3 | 51 | C: N.d. (1/1); N: 3–20% (k = 2), N.d. (1/1) |
| Fluency-semantic | 6 | 100 | C: Worse (2/3); N: 11–53% (k = 3) |
| Fluency-phonemic | 3 | 61 | C: Worse (1/2); N: 3–30% (k = 2) |
| Visuospatial | |||
| Complex figure | 4 | 61 | C: Worse (1/2); N: 11–75% (k = 2) |
| JOLO | 1 | 10 | C: N.d.; N: 10% |
| Executive | |||
| Switching | 4 | 87 | C: Worse (2/3); N: 10–31% (k = 3) |
| Stroop inhibition | 2 | 34 | C: N.d. (1/1); N: 6% (k = 1) |
| Go/No-Go | 1 | 27 | C: Similar RT, more errors |
| Set-shifting | 1 | 11 | N: N.d. |
| Reasoning | 1 | 10 | C: N.d.; N: 0% matrix, 10% similarities |
| Problem solving | 1 | 9 | C: N.d.; N: 44% |
Abbreviations: BVMT = brief visuospatial memory test; C = Comparison to Controls; CANTAB = Cambridge Neuropsychological Test Automated Battery; DCS = Diagnosticum für Cerebralschädigung; I = Normative Impairment; Imm = Immediate; ISI = interstimulus intervals; JOLO = judgement of line orientation; N = comparison to normative data; N.d. = no difference; Rec = Recognition; RT = reaction time; VR = visual reproduction; WMS = Wechsler Memory Scales; Worse = Worse.
Worse denotes statistically significant differences (p < 0.05) between patients and controls; Normative Impairment reported using a cut-off score of z < −1.5 unless otherwise specified; Total Studies indicates the total number of studies reporting each test; Unique Samples indicates the number of nonoverlapping samples used for synthesis; Total Patients indicates the total number of patients included in the synthesis and is the sum of the patients in the nonoverlapping samples; k denotes number of studies.

