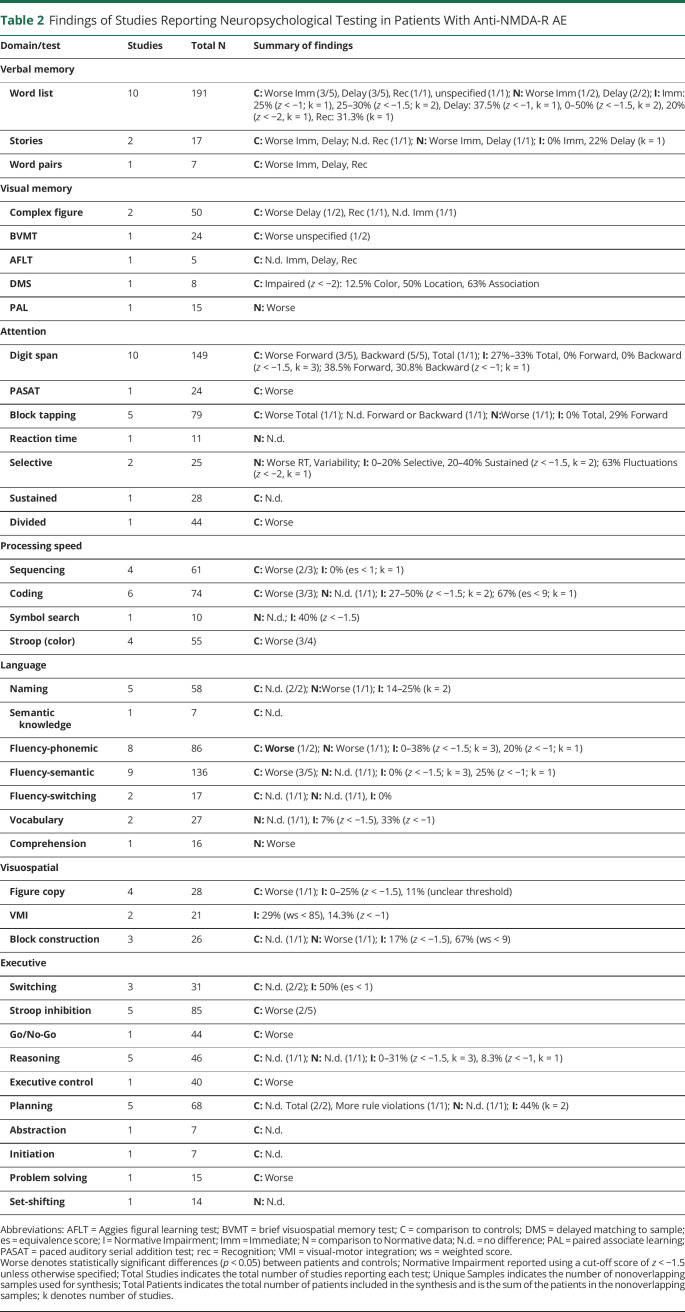
Table 2.
Findings of Studies Reporting Neuropsychological Testing in Patients With Anti-NMDA-R AE
| Domain/test | Studies | Total N | Summary of findings |
| Verbal memory | |||
| Word list | 10 | 191 | C: Worse Imm (3/5), Delay (3/5), Rec (1/1), unspecified (1/1); N: Worse Imm (1/2), Delay (2/2); I: Imm: 25% (z < −1; k = 1), 25–30% (z < −1.5; k = 2), Delay: 37.5% (z < −1, k = 1), 0–50% (z < −1.5, k = 2), 20% (z < −2, k = 1), Rec: 31.3% (k = 1) |
| Stories | 2 | 17 | C: Worse Imm, Delay; N.d. Rec (1/1); N: Worse Imm, Delay (1/1); I: 0% Imm, 22% Delay (k = 1) |
| Word pairs | 1 | 7 | C: Worse Imm, Delay, Rec |
| Visual memory | |||
| Complex figure | 2 | 50 | C: Worse Delay (1/2), Rec (1/1), N.d. Imm (1/1) |
| BVMT | 1 | 24 | C: Worse unspecified (1/2) |
| AFLT | 1 | 5 | C: N.d. Imm, Delay, Rec |
| DMS | 1 | 8 | C: Impaired (z < −2): 12.5% Color, 50% Location, 63% Association |
| PAL | 1 | 15 | N: Worse |
| Attention | |||
| Digit span | 10 | 149 | C: Worse Forward (3/5), Backward (5/5), Total (1/1); I: 27%–33% Total, 0% Forward, 0% Backward (z < −1.5, k = 3); 38.5% Forward, 30.8% Backward (z < −1; k = 1) |
| PASAT | 1 | 24 | C: Worse |
| Block tapping | 5 | 79 | C: Worse Total (1/1); N.d. Forward or Backward (1/1); N:Worse (1/1); I: 0% Total, 29% Forward |
| Reaction time | 1 | 11 | N: N.d. |
| Selective | 2 | 25 | N: Worse RT, Variability; I: 0–20% Selective, 20–40% Sustained (z < −1.5, k = 2); 63% Fluctuations (z < −2, k = 1) |
| Sustained | 1 | 28 | C: N.d. |
| Divided | 1 | 44 | C: Worse |
| Processing speed | |||
| Sequencing | 4 | 61 | C: Worse (2/3); I: 0% (es < 1; k = 1) |
| Coding | 6 | 74 | C: Worse (3/3); N: N.d. (1/1); I: 27–50% (z < −1.5; k = 2); 67% (es < 9; k = 1) |
| Symbol search | 1 | 10 | N: N.d.; I: 40% (z < −1.5) |
| Stroop (color) | 4 | 55 | C: Worse (3/4) |
| Language | |||
| Naming | 5 | 58 | C: N.d. (2/2); N:Worse (1/1); I: 14–25% (k = 2) |
| Semantic knowledge | 1 | 7 | C: N.d. |
| Fluency-phonemic | 8 | 86 | C: Worse (1/2); N: Worse (1/1); I: 0–38% (z < −1.5; k = 3), 20% (z < −1; k = 1) |
| Fluency-semantic | 9 | 136 | C: Worse (3/5); N: N.d. (1/1); I: 0% (z < −1.5; k = 3), 25% (z < −1; k = 1) |
| Fluency-switching | 2 | 17 | C: N.d. (1/1); N: N.d. (1/1), I: 0% |
| Vocabulary | 2 | 27 | N: N.d. (1/1), I: 7% (z < −1.5), 33% (z < −1) |
| Comprehension | 1 | 16 | N: Worse |
| Visuospatial | |||
| Figure copy | 4 | 28 | C: Worse (1/1); I: 0–25% (z < −1.5), 11% (unclear threshold) |
| VMI | 2 | 21 | I: 29% (ws < 85), 14.3% (z < −1) |
| Block construction | 3 | 26 | C: N.d. (1/1); N: Worse (1/1); I: 17% (z < −1.5), 67% (ws < 9) |
| Executive | |||
| Switching | 3 | 31 | C: N.d. (2/2); I: 50% (es < 1) |
| Stroop inhibition | 5 | 85 | C: Worse (2/5) |
| Go/No-Go | 1 | 44 | C: Worse |
| Reasoning | 5 | 46 | C: N.d. (1/1); N: N.d. (1/1); I: 0–31% (z < −1.5, k = 3), 8.3% (z < −1, k = 1) |
| Executive control | 1 | 40 | C: Worse |
| Planning | 5 | 68 | C: N.d. Total (2/2), More rule violations (1/1); N: N.d. (1/1); I: 44% (k = 2) |
| Abstraction | 1 | 7 | C: N.d. |
| Initiation | 1 | 7 | C: N.d. |
| Problem solving | 1 | 15 | C: Worse |
| Set-shifting | 1 | 14 | N: N.d. |
Abbreviations: AFLT = Aggies figural learning test; BVMT = brief visuospatial memory test; C = comparison to controls; DMS = delayed matching to sample; es = equivalence score; I = Normative Impairment; Imm = Immediate; N = comparison to Normative data; N.d. = no difference; PAL = paired associate learning; PASAT = paced auditory serial addition test; rec = Recognition; VMI = visual-motor integration; ws = weighted score.
Worse denotes statistically significant differences (p < 0.05) between patients and controls; Normative Impairment reported using a cut-off score of z < −1.5 unless otherwise specified; Total Studies indicates the total number of studies reporting each test; Unique Samples indicates the number of nonoverlapping samples used for synthesis; Total Patients indicates the total number of patients included in the synthesis and is the sum of the patients in the nonoverlapping samples; k denotes number of studies.

